
|
|
|
 |
 |
 |
|
EGG‑NEWS.com
Egg Industry News, Comments & More by
Simon M.Shane
|
|
 |
|
 |
|
 |
Egg Industry Statistics and Reports
Updated January 2026 USDA Projection for U.S. Egg Production and Consumption.
|
01/16/2026 |
|
 On January 16th 2026 the USDA Economic Research Service (ERS) issued actual values for egg production during 2024 with an updated projection for 2025 and a forecast for 2026. Production, consumption and prices were revised from the previous December 15th 2025 report. On January 16th 2026 the USDA Economic Research Service (ERS) issued actual values for egg production during 2024 with an updated projection for 2025 and a forecast for 2026. Production, consumption and prices were revised from the previous December 15th 2025 report.
Projected egg production for 2025 was adjusted downward from 7,737 million dozen in 2024 by 4.8 percent to 7,366 million dozen due to progressive depletion of hen flocks as a result of HPAI. Heavy losses occurred during Q1 2025 with incident cases extending through December totaling 42.3 million hens for the year. The per capita consumption of shell eggs and liquids combined for 2025 will be 259.2 eggs, down 11.4 egg equivalents (-4.2 percent) from 2024. The projected average 2025 benchmark New York bulk unit price was raised 70 cents per dozen over 2024 to 374 cents per dozen. On January 16th the price was 72 cents per dozen reflecting both increased supply and depressed consumption in that market. Subsequent USDA projections will provide greater clarity on the recovery in consumption in an economy that is undergoing inflation in all food categories with the outstanding exception of eggs, even with retailers maintaining high margins and failing to pass on savings to consumers.
Restoration in flock size after HPAI depletions in 2022 progressed at a net rate of approximately 1.0 million per week offset by losses due to depopulation. Placements were limited by the availability of pullet chicks and for some producers, by the rate of conversion to alternative housing systems. Restoration of the national flock was compromised by a resurgence of HPAI with 40.0 million layers depleted during 2024 but with replacement averaging 24 million pullets per month. On December 31st the total egg-producing flock was estimated by USDA to be 301 million hens, 25  million or 7.7 percent below the nominal flock averaging 326 million hens during 2021 before the onset of the ongoing HPAI epornitic. Effective January 16th the total national flock attained 300.0 million, approximately 26 million (-8.0 percent) below the pre-HPAI level. The productive flock was estimated by the USDA to be 293.4 million on January 14th. Cage-free flocks during December attained 140 million or 46.6 percent of the total. In the January report the Egg Industry Center confirmed a total flock of 302.8 million at the end of December 2025. Unpredictable factors affecting flock size and hence price will include consumer demand as influenced by recently lower shelf prices for generic eggs and the extent of possible losses during the early winter months of the current year. million or 7.7 percent below the nominal flock averaging 326 million hens during 2021 before the onset of the ongoing HPAI epornitic. Effective January 16th the total national flock attained 300.0 million, approximately 26 million (-8.0 percent) below the pre-HPAI level. The productive flock was estimated by the USDA to be 293.4 million on January 14th. Cage-free flocks during December attained 140 million or 46.6 percent of the total. In the January report the Egg Industry Center confirmed a total flock of 302.8 million at the end of December 2025. Unpredictable factors affecting flock size and hence price will include consumer demand as influenced by recently lower shelf prices for generic eggs and the extent of possible losses during the early winter months of the current year.
Exports of eggs and products at approximately 1.8 percent of total production over the first ten months of 2025 attained 104.5 million dozen shell-egg equivalents. This was offset by imports of 108.7 shell egg-equivalents. Exports did not materially affect the domestic price. The U.S. is currently a net importer of egg products and shell eggs for breaking amounting to 4.2 million shell-egg equivalents. Future export volume will be encouraged by low domestic prices and bthe the needs of importing nations but will be constrained by international competition and disease-related embargos.
The USDA forecast for 2026 includes production of 7,900 million dozen, up an optimistic 7.2 percent from 2025. Projected consumption will be 273.7 eggs per capita. This forecast presumes substantial control of HPAI and an adequate supply of replacement chicks and pullets. These are both speculative assumptions in the absence of approved vaccination in high-risk areas. The increase, if it were to become reality would depress the NY Large benchmark price to an average of $1.20 per dozen compared to the 2025 value of $3.73 per dozen for conventional Large white-shelled product in cartons.
Updated January 2024 USDA data is shown in the table below:-
|
Parameter
|
2022*
(actual)
|
2023
(actual)
|
2024*
(actual)
|
2025*
(projection)
|
% Difference
2024-2025
|
|
2026
(forecast)
|
|
|
|
|
|
|
|
|
|
|
Production (million dozen)
|
7,825
|
7,864
|
7,737
|
7,366
|
-4.7
|
|
7,900
|
|
Consumption (eggs per capita)
|
280.5
|
279.3
|
270.6
|
259.2
|
-4.2
|
|
273.7
|
|
New York price (c/doz.)
|
282
|
192
|
303
|
373
|
+23.1
|
|
120
|
*Data influenced by HPAI losses.
Sourcs: Livestock, Dairy and Poultry Outlook released January 16th 2026

|
Trade in Shell Eggs and Products, January through October 2025.
|
01/09/2026 |
|

The volume of exports of shell eggs and products is conditioned by the domestic needs of importers, price against competitors and regulatory disease and logistic restraints. Imports are determined by domestic needs with reduced supply due to flock depopulation as the principal driving factor during the first 10 months of 2025.
USAPEEC data reflecting volume of exports for shell eggs and egg products are shown in the table below comparing 2024 with 2025:-
|
PRODUCT
|
Jan.-Oct. 2024
|
Jan.-Oct. 2025
|
Difference
|
|
Shell Eggs
|
|
|
|
|
Volume (m. dozen)
|
69.8
|
57.6*
|
-12.2 (-17.4%)
|
|
Value ($ million)
|
160.7
|
244.3
|
+83.6 (+52%)
|
|
Unit Value ($/dozen)
|
2.30
|
4.24
|
+1.94 (+84.3%)
|
|
Egg Products
|
|
|
|
|
Volume (metric tons)
|
21,276
|
17,348
|
-3,928 (-18.5%)
|
|
Value ($ million)
|
96.0
|
90.9
|
-5.1 (-5.3%)
|
|
Unit Value ($/metric ton)
|
4,512
|
5,240
|
+928 (+16.1%)
|
U.S. EXPORTS OF SHELL EGG AND EGG PRODUCTS DURING
JANUARY-OCTOBER INCLUSIVE IN 2025 COMPARED WITH 2024
*The data published by USDA for shell eggs are slightly different from USAPEEC figures included in this table.
 For the ten-month period Canada was the export destination of 71.3 percent of U.S. shell eggs followed by the Caribbean at 14.7 percent. For egg products the four major importers collectively comprised 78.4 percent of volume with the relative proportions represented by Japan (28.3%); Canada, (15.7%), Mexico, (16.7%) and the EU, (17.7%). For the ten-month period Canada was the export destination of 71.3 percent of U.S. shell eggs followed by the Caribbean at 14.7 percent. For egg products the four major importers collectively comprised 78.4 percent of volume with the relative proportions represented by Japan (28.3%); Canada, (15.7%), Mexico, (16.7%) and the EU, (17.7%).
According to the USDA Egg Markets Overview, January 9th, shell eggs exported over 10 months attained 50.2 million dozen. This represents the average production of 2.5 million hens or 1.6 percent of the current population of producing hens. All egg products including liquid and dried, attained 54.3 million dozen shell equivalents for a total of 104.5 million dozen shell equivalents over ten months. Imports over the same period comprised 70.1 million dozen shell eggs for breaking and 38.5 million dozen shell egg equivalents over all product forms for a total of 108.7 million dozen shell equivalents
Net trade deficit was therefore 4.2 million dozen shell equivalents
The trade situation during 2026 will be influenced by the needs of importers, a fluid tariff situation, landed price and availability. Since supply has increased in volume with a sharp decrease in domestic price, imports will be curtailed with an expectation of higher exports consistent with a more competitive situation.
|
USDA Cage-Free Production Data for December 2025
|
01/05/2026 |
|
The USDA Cage-Free Report covering December 2025, was released on January 2nd 2026, the first edition since October 1st 2025 covering September
The report documented the complement of hens producing under the Certified Organic Program to be 20.9 million (rounded to 0.1 million), up 0.9 million hens or 4.5 percent since September 2025. The number of hens classified as cage-free (but excluding Certified Organic) and comprising aviary, barn and other systems of housing apparently increased by 2.9 million hens or 2.7 percent from September 2025 to 119.5 million, attributed to expansion, transition from conventional cages and repopulation of depleted flocks.
Extensive depopulation was carried out as a result of HPAI through the fourth quarter of 2024 and continuing in January and February 2025 (31 million), but with lower intensity in March (0.2 million) and April (1.0 million) and a single large complex in Arizona during May (3.8 million). Losses reemerged during late September in a caged-bird complex in Wisconsin (3.1 million hens and 250,000 pullets). Additional depopulations occurred in October, (2.2 million); November, 0.5 million and December, (0.2 million).
Average weekly production for Certified Organic eggs in December 2025 was up 5.1 percent percent (rounded) compared to September 2025 with a high average weekly production of 83.3 percent. Average weekly flock production for cage-free flocks other than Certified Organic was up 2.7 percent in December 2025, with a high average hen-month production of 82.1 percent. Seasonally placed flocks in anticipation of periods of peak demand increase the availability of cage-free and organic eggs, reflecting pullet chick placements 20 weeks previously.
There is no adequate explanation for the elevated production rates recorded other than the high proportion of young hens reaching peak placed in anticipation of December demand. It is also assumed that almost all cage free flocks are in the first cycle of production with negligible molting contributing to the high average in hen-week values compared to caged hens.
Due to the Federal shutdown and temporary cessation of the USDA Egg Markets Overview and available data from the weekly USDA Shell Egg Demand Indicator, the categorization of U.S. flocks according to housing system for December was unavailable among the assumed 290 million producing hens. The breakdown will be provided when data is released.
Losses attributed to HPAI in 2025 comprised:-
Caged flocks, 24.8 million representing 8.4 percent of a nominal 290 million producing hens
Cage-free flocks, 17.6 million representing 5.9 percent of the national flock
Organic flocks, negligible, >0.1 percent
|
Average Flock Size
(million hens)
|
Average
December 2025
|
Average
Q3- 2025
|
Average
Q2- 2025
|
Average
Q1 –
2025
|
Average
Q4 –
2024
|
Average
Q3-
2024
|
|
Certified Organic
|
20.9
|
20.0
|
20.0
|
20.4
|
20.5
|
20.0
|
|
Cage-Free Hens
|
119.5
|
115.6
|
108.4
|
103.4
|
104.5
|
103.9
|
|
Total Non-Caged
|
140.4
|
135.6
|
128.4
|
123.8
|
125.0
|
123.9
|
|
Average Weekly Production (cases of 360 eggs)
|
September
2025
|
December
2025
|
|
Certified Organic @ 83.3% hen/day
|
322,370
|
338,683 +5.1%
|
|
Cage-Free @ 82.1% hen/day
|
1,857,403
|
1,908,273 +2.7%
|
|
All Non-Caged @ 82.3% hen/day
|
2,179,773
|
2,246,956 +3.0%
|
On December 29th USDA recorded the following National inventory levels expressed in 30-dozen cases (rounded) with the change from September as a percentage of the total quantity of eggs:-
Commodity shell eggs of all sizes. 1,516,800. (-2.7%)
Commodity breaking stock. 404,100. (+17.5%)
Specialty eggs. 45,500. (+16.3%)
Certified organic eggs. 86,900. (-2.6%)
Cage-Free eggs 425,700. (-3.0%) equivalent to 1.5 days production
|
Average Nest Run Contract Price Cage-Free
White and Brown combined for December
|
$1.73/doz.* (unchanged from May)
|
|
December 2025 Range:
|
$1.55 to $2.10/doz. (unchanged from May)
|
|
FOB Negotiated December price, grade-ready quality, loose nest-run. Price range $1.00 to $2.45 per dozen
|
Average December 2025 Value of $1.10/doz. ($1.43/doz. September 2025)
|
*Essentially a meaningless value
|
Average December 2025 advertisedpromotional National Retail Price C-F, Large Brown
|
$3.43/doz. Dec. 2025 (5 regions)
(Was $3.41/doz. In September 2025)
|
|
USDA Based on 6 ‘Lower 48’ Regions, 1,646 stores
SW, NW, NE, SE, MW & SC.
|
Range $3.99/doz. (NW) to $2.50/doz. (SW)
|
Negotiated nest-run grade-ready cage-free price for December 2025 averaged $0.88 per dozen, down $0.59 per dozen (-40.1 percent) from $1.47 per dozen in September 2025, reflecting a disturbance in balance between demand and supply.
The December 2025 advertised U.S. featured retail price for Large White cage-free eggs over 1,646 ‘Lower 48’ stores in six regions (NW, NE, SE, SW, MW and SC.) was $2.63 per dozen. This compares with 1,182 stores featuring cage-free Large White in September and reflects more promotions as the year has progressed, consistent with lower demand and increased production. The Decenber 2025 advertised U.S. featured retail price for Large Brown cage-free eggs over 2,819 stores in six regions was $3.43 per dozen with a range of $2.50 per dozen in the SC region to $4.09 per dozen in the SW region. The average promotional shelf price was only 3 cents per dozen above September for this category
The recorded average gradeable nest run price of $0.88 per dozen for brown and white cage-free combined plus a provision of $0.60 cents per dozen for packaging, packing and transport, resulted in a theoretical price of $1.48 per dozen delivered to CDs. The average advertised promotional retail prices of $3.43 per dozen for Brown and $2.63 per dozen for white represented retail margins of 131 percent for featured Brown and 77 percent for White respectively. Fewer promotions were offered for White compared to Brown cage-free by stores reflecting the balance between supply and demand for the two broad categories. Margins are presumed higher for non-featured eggs including pastured and other specialty eggs at shelf prices attaining in excess of $8.00 per dozen in high-end supermarket chains. Retailers are maximizing margins especially on Certified Organic, free-range and pastured categories restricting the volumes of sales, of all categories ultimately disadvantageous to producers and consumers.
|
REVIEW OF NOVEMBER 2025 EGG PRODUCTION COSTS
|
12/15/2025 |
|
This update of U.S egg-production costs and available prices is provided for the information of producers and stakeholders. Statistical data was unavailable for October and November due to the Federal shutdown and has yet to be updated. December figures will hopefully be available for inclusion in the January edition. September values for production and November cost and price updates provided by the EIC are included in this review
NOVEMBER HIGHLIGHTS
- November 2025 USDA ex-farm blended USDA nest-run, benchmark price for conventional eggs from caged hens was 181 cents per dozen, up 64 cents per dozen or 54.7 percent from the October 2025 value of 117 cents per dozen. The corresponding November 2023 and 2024 values were respectively $1.63 and $3.64 cents per dozen. For annual comparison, average monthly USDA benchmark price over 2023 was 146 cents per dozen compared to 247 cents per dozen covering 2024. Stock levels and prices prior to the onset of flock depletions due to HPAI indicated a relative seasonal balance between supply and demand. Future nest-run and wholesale prices will be largely dependent on consumer demand for shell eggs and products, as determined by the economy, supply as influenced by flock placements, re-emergence of HPAI, net imports and the rate of replacement of pullets and hens depleted. Other considerations include diversion to shell sales from the egg-breaking sector in an interconnected industry. Imports of shell eggs continued during the past three months with the cumulative negative trade balance attaining 24.5 million dozen shell equivalents through August. During August the negative trade balance in shell eggs amounted to 4.0 million dozen. For 2025 through August, U.S. liquid and dried products combined achieved a positive trade balance of 5.6 million with August rising to 2.1 million dozen shell egg equivalents. (It is noted that Brazil released export data covering shell eggs in November during mid-December)
- November 2025 USDA ex-farm negotiated USDA nest-run, benchmark price for all categories of cage-free eggs was not released. The September 2025 value was147 cents per dozen. The corresponding November 2023 and 2024 values were respectively 123 and 455 cents per dozen.
- Fluctuation in wholesale price is attributed in part to the amplification of upward and downward swings associated with the commercial benchmark price-discovery system in use. An important factor influencing pricing is the proportion of shell eggs supplied under cost-plus contracts accentuating the upward and downward price trajectory of uncommitted eggs as determined by the price discovery system. Highly pathogenic avian influenza was the major driver of price in 2024 and through Q1 of 2025 due to the high incidence rate. Approximately 40 million hens and at least 2.0 million pullets were depleted in 2024 with close to an additional 36 million birds, (hens and pullets) in 35 complexes or farms through mid-May 2025. The Fall 2025 losses involved complexes of 3.1 million hens in late September and 2.0 million in early October. During November 570,000 hens producing table eggs were depopulated on 22 farms in close geographic proximity with flock losses averaging 24,000 per case suggesting contract producers of cage free eggs with common risk factors including feed supply and egg collection. This trend is a departure from losses involving a few very large complexes evident in the wave of cases during early fall.
- November 2025 USDA average nest-run production cost for conventional eggs from caged flocks over four regions (excluding SW and West), applying updated inputs was 75.7 cents per dozen, up 1.9 cents from October 2025 at 73.8 cents per dozen. The November average nest run production cost for other than caged and certified organic hens was estimated by the EIC to be 95.3 cents per dozen up 2.2 cents per dozen from October. Approximately 60 cents per dozen should be added to the USDA benchmark nest-run costs to cover processing, packing material and transport to establish a realistic cost value as delivered to warehouses.
- November 2025 USDA benchmark nest-run margin for conventional eggs attained a positive value of 105.3 cents per dozen compared to a positive margin of 43.2 cents per dozen in October 2025. Year to date the average monthly nest-run production margin has attained 255.9 cents per dozen. Average nest-run monthly margin for 2024 was 170.8 cents per dozen compared to 64.2 cents per dozen in 2023 and 155 cents in 2022.
- November 2025 USDA benchmark nest-run margin for all categories of cage-free eggs could not be ascertained due to non-release of USDA data. In October margin attained a positive value of 40.9 cents per dozen compared to a positive margin of 53.1 cents per dozen in September 2025. Through October the average monthly nest-run production margin attained 321.1 cents per dozen. Average nest-run monthly margin over 2024 was 440 cents per dozen compared with 100 cents per dozen in 2023, relatively unaffected by HPAI compared to the preceding and following years.
Since data for October and November production and September exports was unavailable as of mid-December values for the most recent reported month of August are retained in the following paragraphs.
- The August 2025 national flock (over 30,000 hens per farm) was stated by the USDA to be up by 6.6 million hens (rounded, and a probable undercount) to 285.9 million compared to approximately 326 million before the advent of the H5N1 epornitic of HPAI in 2022. Approximately 3.5 million hens returned to production from molt during the month together with projected maturation of 23 million pullets, with the total offset by depletion of an unknown number of spent hens. On October 8th USDA estimated the total U.S table-egg production flock at 304.5 million with 298.1 million actually in production.
- August 2025 pullet chick hatch of 28.7 million was down 0.4 million (-1.4 percent) from July 2025 but inconsistent with an increased industry need to replace depopulated flocks.
- August September export data will be released after resumption of Federal activities. In July 2025 exports of shell eggs and products combined were up 27.1 percent from June 2025 to 376,600 case equivalents representing the theoretical production of 5.6 million hens. Shell egg exports totaling 72,000 cases were dominated by Canada (38 percent of volume) the “Rest of Americas” including the Caribbean (40 percent). With respect to 304,000 case equivalents of egg products, importers comprised Canada (32 percent of volume), “Rest of Americas and the EU (each 20 percent), Japan, (12 percent), Mexico, (8 percent) collectively representing 98 percent of shipments. Volumes exported are based on the needs of importers, competing suppliers, availability in the U.S. and FOB prices offered.
- According to the USDA Egg Market Overview released on September 8th, all egg imports (shell, liquid and dry) in July attained 19.5 million dozen shell equivalents compared to exports of all categories of 11.2 million dozen shell equivalents.
- For 2025 through July the negative trade balance in all shell and derived egg products attained 15.5 million dozen shell equivalents.
 |
TABLES SHOWING KEY PARAMETERS FOR NOVEMBER 2025.
Summary tables for the latest USDA November 2025 costs and unit prices were made available by the EIC on December 9th 2025. Data is arranged, summarized, tabulated and compared with values from the previous November 7th 2025 release reflecting October 2025 costs and production data, as revised and applicable. Monthly comparisons of production data and costs are based on revised USDA and EIC values.
VOLUMES OF PRODUCTION REFLECTING THE ENTIRE INDUSTRY
|
PARAMETER
|
SEPTEMBER 2025
|
NOVEMBER 2025*
|
|
Table-strain eggs in incubators
|
55.0 million (Sept.)
|
million (Nov.)
|
|
Pullet chicks hatched
|
28.7 million (Aug.)
|
million (Oct)
|
|
Pullets to be housed 5 months after hatch
|
25.9 million (Feb. ‘26)
|
million (Mar ’26)
|
|
EIC 2025 December 1st U.S. total flock projection
|
316.7 million (Sept.)
|
million (Oct.)
|
|
National Flock in farms over 30,000
|
285.9 million (Aug.)
|
million (Sept.)
|
|
National egg-producing flock
|
299.0 million (Aug.)
|
308.7 million (Dec)1
|
|
Cage-free flock excluding organic
Cage-free organic flock
|
116.6 million (Sept.)
20.0 million (Sept.)
|
million (Nov.)
million (Nov.)
|
|
Proportion of flocks in molt or post-molt
|
11.9% (Sept)
|
% (Nov.)
|
|
Total of hens in National flock, 1st cycle (estimate)
|
253.4 million (Aug.)
|
million (Nov.)
|
*USDA data unavailable
- From USDA Weekly Shell-egg Demand Indicator December 10th
|
Total U.S. Eggs produced (billion)
|
7.59 August 2025
|
NOVEMBER 2025
|
|
Total Cage-Free hens in production
Proportion of organic population
|
136.6 million (Sept.)
14.6% Organic
|
million (Nov.)
% Organic
|
|
“Top-5” States hen population (USDA)1
|
141.8 million (Aug.)
|
million (Nov.)
|
*Revised USDA/EIC Note 1. Texas excluded to maintain confidentiality
PROPORTION OF U.S. TOTAL HENS BY STATE, 2025
Based on a nominal denominator of 285 million hens in flocks over 30,000 covering 95 percent of the U.S complement.
USDA has amended inclusion of specific states in regions and eliminated Texas data to protect confidentiality of Company flock
Sizes
|
STATE
|
AUGUST1
2025
|
November
2025
|
|
Iowa
|
15.3%
|
%
|
|
Indiana
|
12.2%
|
%
|
|
Ohio
|
12.5%
|
%
|
|
Pennsylvania
|
8.0%
|
%
|
|
Texas (estimate)
|
8.3% ?
|
%?
|
|
California
|
1.7%
|
%
|
- Values rounded to 0.1%
Rate of Lay, weighted hen-month (USDA) 81.5 September 2025. % November 2025
*Revised USDA
|
Revised per capita
|
Egg consumption 2020
|
285.6 (down 7.8 eggs from 2019)
|
|
Revised per capita
|
Egg consumption 2021
|
282.5 (down 3.1 eggs from 2020)
|
|
Actual per capita
|
Egg consumption 2022
|
280.5 (down 2.0 eggs from 2021 due to HPAI)
|
|
Actual per capita
|
Egg consumption 2023
|
278.0 (down 2.5 eggs from 2022)
|
|
Actual per capita
Forecast per capita
Projection per capita
|
Egg consumption 2024
Egg consumption 2025
Egg consumption 2026
|
270.6 (down 7.2 eggs from 2023) attributed to HPAI losses*
261.0 (down 9.6 eggs from 2024) forecast adjusted for HPAI losses , was 258.2 last month but this was aspirational
276.4 (up 18.4 eggs from 2025 assuming restoration of flocks and without HPAI losses)
|
*Revised, using data from USDA Livestock, Dairy and Poultry Outlook September 18th 2025 taking into account demand from the food service sector and presumably including the effect of HPAI depopulation and net importation.
EGG INVENTORIES AT BEGINNING OF SEPTEMBER 2025:
|
Shell Eggs
|
1.59 million cases in December down 6.4 percent from September 20251
|
|
Frozen Egg
Products
|
514,960 case equivalents, up 28.0 percent from August 2025
|
|
Dried Egg
Products
|
Not disclosed since March 2020 following market disruption due
To COVID. Moderate levels of inventory are assumed.
|
- USDA Weekly Shell Egg Inventory Report December 15th.
EGGS BROKEN UNDER FSIS INSPECTION (MILLION CASES) AUGUST 2025, 7.03 November 2025,
|
Cumulative eggs broken under FSIS inspection 2024 (million cases)
|
77.2
|
JAN. TO DEC.
|
|
Cumulative 2024: number of cases produced (million)
|
257.9
|
JAN. TO DEC.
|
|
Cumulative 2024: proportion of total eggs broken
|
29.9%
|
(30.8% 2022)
|
| |
|
|
|
Cumulative eggs broken under FSIS inspection 2025 (million cases)
|
52.3
|
JAN.-AUG.
|
|
Cumulative 2025: number of cases produced (million)
|
161.6
|
JAN.-AUG.
|
|
Cumulative 2025: proportion of total eggs broken
|
32.3%
|
JAN.-AUG.
|
Export and import data for August was not released due to Federal shutdown.
EXPORTS JULY 2025: (Expressed as shell-equivalent cases of 360 eggs).
|
Parameter
|
Quantity Exported
|
|
Exports:
|
2025
|
|
Shell Eggs (thousand cases)
|
JUNE 148. JULY 72
|
|
Products (thousand case equivalents)
|
JUNE. 148. JULY. 304
|
|
TOTAL (thousand case equivalents)*
|
JUNE. 296. JULY 376
|
*Representing 1.8 percent of National production in JULY 2025 (0.4% shell, 1.4% products).
COSTS AND UNIT REVENUE VALUES1 FOR CONVENTIONAL EGGS FROM CAGED HENS
|
Parameter
|
NOVEMBER 2025
|
OCTOBER 2025
|
|
4-Region Cost of Production ex farm (1st Cycle)1
|
75.7 c/doz
|
73.8 c/doz
|
|
Low
|
73.7c/doz (MW)
|
71.9 c/doz (MW)
|
|
High
|
77.7 c/doz (NE)
|
75.6c/doz (NE)
|
Notes: 1. Excludes SW and West representing an important deficiency
Components of Production cost per dozen:-
| |
NOVEMBER 2025
|
OCTOBER 2025
|
|
Feed
|
35.0 c/doz
|
33.3c/doz
|
|
Pullet depreciation
|
12.0 c/doz
|
11.8c/doz
|
|
Labor (estimate) plus
|
|
|
|
Housing (estimate) plus
|
28.7c/doz
|
28.7c/doz
|
|
Miscellaneous and other (adjusted May 2023)
|
|
|
Ex Farm Margin (rounded to nearest cent) according to USDA values reflecting November2025:-
181.0 cents per dozen1- 75.7 cents per dozen =105.3 cents per dozen (October 2025 comparison: 117.0 cents per dozen – 73.8 cents per dozen = 43.2 cents per dozen.
Note 1: USDA Blended nest-run egg price
| |
|
NOVEMBER 2025
|
OCTOBER 2025
|
|
USDA
|
Ex-farm Price (Large, White)
|
181.0 c/doz (Nov.)
|
117.0c/doz (Oct.)
|
| |
Warehouse/Dist. Center
|
236.0 c/doz (Nov.)
|
160.0c/doz (Oct.)
|
| |
Store delivered (estimate)
|
242.0 c/doz (Nov.)
|
166.0 c/doz (Oct.)
|
| |
Dept. Commerce Retail1 National
|
349.0 c/doz (Nov.)
|
349.0 c/doz (Oct.)
|
| |
Dept. Commerce Retail1 Midwest
|
363.0 c/doz (Nov.)
|
333.0 c/doz (Oct.)
|
- Unrealistic USDA values based on advertised promotional prices with few participating stores, non-representative of shelf prices!
| |
NOVEMBER 2025
|
OCTOBER 2025
|
|
U.S. Av Feed Cost per ton
|
$226.50
|
$215.59
|
|
Low Cost – Midwest
|
$205.31
|
$195.34
|
|
High Cost – West
|
$265.32
|
$253.05
|
|
Differential
Corn/ton 5 regions
Soybean meal/ton 5 regions
|
$ 60.01
$170.70
$341.51
|
$ 57.71
$165.52
$308.90
|
|
Pullet Cost 19 Weeks
|
$4.66 NOVEMBER 2025
|
$4.58 OCTOBER 2025
|
|
Pullet Cost 16 Weeks
|
$4.10 NOVEMBER 2025
|
$4.04 OCTOBER 2025
|
AVERAGE COSTS AND UNIT REVENUE FOR EGGS FROM CAGE-FREE HENS
|
Parameter
|
NOVEMBER 2025
|
OCTOBER 2025
|
|
5-Region Cost of Production ex farm (1st Cycle)
|
95.3 c/doz
|
93.1 c/doz
|
|
Low
|
91.1c/doz (MW)
|
89.1 c/doz (MW)
|
|
High
|
103.1 c/doz (West)
|
100.6 c/doz (West)
|
Components of Production cost for cage-free eggs, per dozen:-
| |
NOVEMBER 2025
|
OCTOBER 2025
|
|
Feed (non-organic)
|
40.5 c/doz
|
38.6 c/doz
|
|
Pullet depreciation
|
15.8 c/doz
|
15.6 c/doz
|
|
Labor (estimate) plus
|
|
|
|
Housing (estimate) plus
|
39.0c/doz
|
38.9 c/doz
|
|
Miscellaneous and other
|
|
|
Ex Farm Margin (rounded to cent) according to USDA values reflecting negotiated price for OCTOBER 2025:- (November not disclosed)
Cage-Free brown 134.0 cents per dozen1- 93.1 cents per dozen = 40.9 cents per dozen
September 2025:- 147.0 cents per dozen - 93.9 cents per dozen = 53.1 cents per dozen
| |
|
NOVEMBER 2025
|
OCTOBER 2025
|
|
USDA
|
USDA Average Ex-farm Price1
Gradable nest run2
|
173 c/doz (Nov.)
c/doz. (Nov.)
|
173 c/doz (Oct .)
c/doz. (Oct.)
|
| |
Warehouse/Dist. Center3
|
c/doz (Nov.)
|
c/doz (Oct.)
|
| |
Store delivered (estimate)
|
c/doz (Nov.)
|
c/doz (Oct.)
|
| |
Dept. Com. Retail4 C-F White
Dept. Com. Retail4 C-F Brown
|
562 c/doz (Nov.)
675 c/doz (Nov.)
|
c/doz (Oct.)
c/doz (Oct.)
|
| |
Dept. Com. Retail3 Organic
Dept. Com. Retail3 Pasture
|
568 c/doz (Nov.)
646 c/doz (Nov.)
|
570 c/doz (Oct.)
661 c/doz. (Oct.)
|
Contract price, nest-run loose. Range 155 to 210 c/doz. Negligible change since July 2024 and totally unrealistic.- Negotiated price, loose. Range $1.20 to $2.60 per dozen
- Estimate based on prevailing costs
- Unrealistic USDA values based on promotional prices with few participating stores and non-representative of shelf prices
Cage-Free HPAI losses unknown during November
|
Cage-Free* Pullet Cost 19 Weeks
|
$5.66 NOVEMBER 2025
|
$5.57 OCTOBER 2025
|
|
Cage-Free* Pullet Cost 16 Weeks
|
$4.95 NOVEMBER 2025
|
$4.89 OCTOBER 2025
|
* Conventional (non-organic) feed
Feed prices used are the average national and regional values for caged flocks. Excludes organic feeds with prices substantially higher than conventional.
|
USDA-WASDE REPORT #666. December 9th 2025
|
12/09/2025 |
|
OVERVIEW
 Understandably the December 9th edition of the World Agriculture Supply and Demand Estimates (WASDE) #666 was little changed with respect to corn and soybeans from the post-shutdown November 18th edition reflecting the 2025 crop. Crop size and ending stocks were derived from actual harvest data, projections for domestic use and the effect of tariff policy and competition that influence export volumes Understandably the December 9th edition of the World Agriculture Supply and Demand Estimates (WASDE) #666 was little changed with respect to corn and soybeans from the post-shutdown November 18th edition reflecting the 2025 crop. Crop size and ending stocks were derived from actual harvest data, projections for domestic use and the effect of tariff policy and competition that influence export volumes
The December WASDE report reconfirmed that the 2025 corn crop was harvested from an expanded 90.0 million acres, (82.7 million acres in 2024). The soybean crop was harvested from a reduced 80.3 million acres, (86.3 million acres in 2024).
The December WASDE yield value for the 2025 corn crop was retained at 186.0 bushels per acre, unchanged from November. By comparison corn yield was 183.1 bushels per acre in 2024. Soybean yield was held at 53.0 bushels per acre, unchanged from November reflecting harvest data. By comparison soybean yield was 51.7 bushels per acre for the previous 2024 crop.
 The December WASDE projection for the ending stock of corn was lowered by 5.8 percent from November to 2,029 million bushels. The December USDA projection for the ending stock of soybeans was unchanged from November at 290 million bushels consistent with domestic use and export projections. The December WASDE projection for the ending stock of corn was lowered by 5.8 percent from November to 2,029 million bushels. The December USDA projection for the ending stock of soybeans was unchanged from November at 290 million bushels consistent with domestic use and export projections.
The December WASDE retained the projected corn price for the 2025-2026 market year at an average of 400 cents per bushel. The projected average season price for soybeans was held at 1,050 cents per bushel. The price of soybean meal was unchanged from November at $300 per ton.
USDA commodity prices suggest higher feed costs for livestock and poultry producers especially if promised exports materialize. Farmers including corn growers will then benefit from increased prices. In some areas return from corn will be below break-even given relative yields, production costs and depressed per bushel prices. The USDA has announced an allocation of $12 billion to row-crop farmers to compensate for prolonged low commodity prices resulting from reduced exports occasioned by tariffs imposed by the U.S.
Projections for world output included in the December 2025 WASDE report, reflect the most recent estimates for the production and export of commodities especially in the Southern Hemisphere with an emphasis on volumes and prices offered by Argentine and Brazil. Economists also considered the impact of weather patterns arising from the La Nina event especially on South America.
It is accepted that USDA projections for exports will be influenced by the fluid situation relating to tariffs. Estimates of exports are also based on the perceived intentions and needs of China. This Nation sharply curtailed purchases of commodities and especially U.S. soybeans during the 2024-2025 market year and the current year to date.
CORN
Production parameters for corn were unchanged from the November WASDE, reflecting actual harvest data and updated projections for domestic use and trade. The December WASDE Report projected a 2025 crop of 16,752 million bushels, compared to 15,413 million bushels for the previous 2024 record harvest. The “Feed and Residual” category was unchanged from September at 6,100 million bushels. The Food and Seed category was projected at 1,380 million bushels. The Ethanol and Byproducts Category was retained at 5,600 million bushels consistent with estimated demand for E-10 and higher blends for driving needs in late fall and winter months. Projected corn exports were raised 4.1 percent to 3,300 million bushels, based on recent orders and shipments. The anticipated ending stock of corn will be 2,029 million bushels or 11.1 percent of projected availability.
The forecast USDA average season farm price for corn in the December WASDE report was 400 cents per bushel. At close of trading after the noon November 14th release of the WASDE, the CME spot price for corn was 448 cents per bushel, 12.0 percent above the USDA projection but unchanged from the November 18th CME price.
DECEMBER 2025 WASDE #666 Summary for the 2025 Corn Harvest:
|
Harvest Area
|
90.0 million acres
|
(98.7 m. acres planted, with harvest corresponding to 91.2% of acres planted)
|
|
Yield
|
186.0 bushels per acre
|
(Updated from 186.7 bushels per acre in the Sept. WASDE)
|
|
Beginning Stocks
|
1,532 m. bushels
|
|
|
Production
|
16,752 m. bushels
|
|
|
Imports
|
25 m. bushels
|
|
|
Total Supply
|
18,309 m. bushels
|
Proportion of Supply
|
|
Feed & Residual
|
6,100 m. bushels
|
33.3%
|
|
Food & Seed
|
1,380 m bushels
|
7.5%
|
|
Ethanol & Byproducts
|
5,600 m. bushels
|
30.6%
|
|
Domestic Use
|
13,080 m. bushels
|
71.4%
|
|
Exports
|
3,200 m. bushels
|
17.5%
|
|
Ending Stocks
|
2,029 m. bushels
|
11.1%
|
Average Farm Price: 400 cents per bushel. (Unchanged from the December WASDE)
SOYBEANS
Projections for soybeans were retained from the November WASDE, with a 2025 yield of 53.0 bushels per acre but with a reduced area of 81.1 million acres planted compared to 2024. The December WASDE retained the soybean crop at 4,254 million bushels. Crush volume was held from November at 2,555 million bushels despite recently increased industry capacity. Projected exports were held at 1,635 million bushels despite the prospect of increased imports by China following uncertainty over tariffs and diplomatic conflict. Ending stocks were anticipated to be 290 million bushels, unchanged from the November WASDE. Prior to 2018, China, the largest trading partner for U.S. agricultural commodities, imported the equivalent of 25 percent of U.S. soybeans harvested.
 The December USDA WASDE projection for the ex-farm price for soybeans was unchanged from November at 1,050 cents per bushel. At close of trading on December 9th following the noon release of the WASDE, the CME spot price was 1,088 cents per bushel, 3.6 percent above the December USDA projection and 3.5 percent below the November 18th CME price. The December USDA WASDE projection for the ex-farm price for soybeans was unchanged from November at 1,050 cents per bushel. At close of trading on December 9th following the noon release of the WASDE, the CME spot price was 1,088 cents per bushel, 3.6 percent above the December USDA projection and 3.5 percent below the November 18th CME price.
DECEMBER 2025 WASDE #666 Summary for the 2025 Soybean Harvest:-
|
Harvest Area
|
80.3 million acres
|
81.1 m. acres planted. Harvest corresponding to 99.0% of planted acreage)
|
|
Yield
|
53.0 bushels per acre
|
(Updated from 53.5 bushels/acre in the September WASDE)
|
|
Beginning Stocks
|
316 m. bushels
|
|
|
Production
|
4,254 m. bushels
|
|
|
Imports
|
20 m. bushels
|
|
|
Total Supply
|
4,590 m. bushels
|
Proportion of Supply
|
|
Crush Volume
|
2,555 m. bushels
|
55.7%
|
|
Exports
|
1,635 m. bushels
|
35.6%
|
|
Seed
|
73 m. bushels
|
1.6%
|
|
Residual
|
37 m. bushels
|
0.8%
|
|
Total Use
|
4,300 m. bushels
|
93.7%
|
|
Ending Stocks
|
290 m. bushels
|
6.3%
|
Average Farm Price: 1,050 cents per bushel (Unchanged from November)
SOYBEAN MEAL
The projected parameters for soybean meal were retained from the November WASDE. Production will attain 60.2 million tons, consistent with the unchsnged soybean crush volume of 2,555 million bushels. Projected production reflects the stagnant demand for biodiesel despite expanded U.S. crushing capacity. Crush volume is driven both by exports and domestic consumption for livestock feed and for soy oil supplying the food and biodiesel segments. The projection of domestic use was 41.7 million tons. Exports were estimated at 19.2 million tons.
The USDA projected the ex-plant price of soybean meal at $300 unchanged from the November WASDE as an average for the season based on supply and demand considerations. USDA predicted an ending stock of 475,000 tons representing 0.8 percent of supply.
At close of trading on December 9th the CME spot price for soybean meal was $301 per ton, up $1 per ton (0.3 percent) compared to the December WASDE projection of $300 per ton and down 8.2 percent from the November 18th CME price.
DECEMBER 2025 WASDE #666 Projection of Soybean Meal Production and Use
|
Beginning Stocks
|
450
|
|
Production
|
60,225
|
|
Imports
|
675
|
|
Total Supply
|
61,350
|
|
Domestic Use
|
41,675
|
|
Exports
|
19,200
|
|
Total Use
|
60,875
|
|
Ending Stocks
|
475
|
(Quantities in thousand short tons)
Average Price ex plant:$300 per ton (Unchanged from the November WASDE)
IMPLICATIONS FOR PRODUCTION COST
The price projections based on CME quotations for corn and soybeans suggest higher feed production costs for broilers and eggs. Going forward, prices of commodities will be determined by World supply and demand and U.S. domestic use and exports.
For each 10 cents per bushel change in corn:-
- The cost of egg production would change by 0.45 cent per dozen
- The cost of broiler production would change by 0.25 cent per live pound
For each $10 per ton change in the cost of soybean meal:-
- The cost of egg production would change by 0.35 cent per doze
- The cost of broiler production would change by 0.30 cent per live pound.
WORLD SITUATION
With respect to world coarse grains and oilseeds the December 2025 WASDE Report included the following appraisals by USDA:-
COARSE GRAINS:
“Global coarse grain production for 2025/26 is forecast down slightly to 1.576 billion tons. The
2025/26 foreign coarse grain outlook is for lower production, trade, and higher ending stocks
relative to last month. Foreign corn production is cut with declines for Ukraine, Canada,
Nigeria, Indonesia, and Senegal partially offset by increases for the EU, Russia, and
Zimbabwe. Ukraine corn production is sharply lower with reductions to both area and yield
based on reported government data to date, where harvest has been slow as a result of wet
conditions in key growing areas. Canada corn is reduced based on the latest information
from Statistics Canada. The EU is raised reflecting increases for Spain, Hungary, Romania,
and Poland. Foreign barley production is higher with increases for Canada, the EU, and
Australia”.
“Corn exports for 2025/26 are raised for the United States but lowered for Ukraine. Corn
imports are higher for Colombia with cuts for the EU and Zimbabwe. Barley exports are
raised for Australia, Canada, and the EU while Ukraine is reduced. Foreign corn ending
stocks are higher based on an increase for Argentina partly offset by declines for Ukraine
and Canada. Global corn stocks, at 279.2 million tons, are down 2.2 million”.
OILSEEDS:
 “Global oilseed production for 2025/26 is raised this month, driven mainly by higher rapeseed, peanut, and soybean production, partially offset by lower sunflowerseed output. Global rapeseed production is raised 3.0 million tons, with increases for Canada, Australia, and Russia. Canada has the largest increase, up 2.0 million tons to a record 22.0 million, based on the latest Statistics Canada report. Higher rapeseed production is mostly offset by lower global sunflowerseed production, down 2.5 million tons on harvest results for Ukraine and Russia. Current and historical peanut production is raised for Nigeria on official area data. “Global oilseed production for 2025/26 is raised this month, driven mainly by higher rapeseed, peanut, and soybean production, partially offset by lower sunflowerseed output. Global rapeseed production is raised 3.0 million tons, with increases for Canada, Australia, and Russia. Canada has the largest increase, up 2.0 million tons to a record 22.0 million, based on the latest Statistics Canada report. Higher rapeseed production is mostly offset by lower global sunflowerseed production, down 2.5 million tons on harvest results for Ukraine and Russia. Current and historical peanut production is raised for Nigeria on official area data.
The 2025/26 global soybean outlook includes higher production, increased crush, lower exports, and raised ending stocks.”
“Global soybean production is increased 0.8 million tons to 422.5 million, reflecting higher crops for Russia and India but lower output for Canada and Ukraine. Global soybean crush for 2025/26 is increased 0.3 million tons to 365.2 million, mainly on higher supplies in Russia and India. Global soybean exports are lowered 0.3 million tons on lower shipments for Ukraine and Benin. Imports are reduced for Japan, Russia, and Saudi Arabia but raised for Brazil. Global soybean ending stocks are increased 0.4 million tons to 122.4 million, mainly on higher stocks for Brazil and Russia”.
World and U.S. Data Combined for Coarse Grains and Oilseeds:-
|
Factor: Million m. tons
|
Coarse Grains
|
Oilseeds
|
|
Output
|
1,576*
|
690
|
|
Supply
|
1,898
|
832
|
|
World Trade
|
249
|
215
|
|
Use
|
1,588
|
578
|
|
Ending Stocks
|
310
|
144
|
*Values rounded to one million metric ton
(1 metric ton corn= 39.37 bushels. 1 metric ton of soybeans = 36.74 bushels)
(“ton” represents 2,000 pounds)
|
USDA-WASDE REPORT #664, September 12th 2025
|
09/12/2025 |
|
OVERVIEW
The USDA provided updated projections for the production of corn and soybeans in the September 12th World Agriculture Supply and Demand Estimates (WASDE) #664, reflecting the 2025 crop. Production values for corn and soybeans were updated from previous editions. Projections of crop size and ending stocks are derived from acreage planted, recent annual crop yields, the latest crop progress reports, data relating to domestic use and predictions of the effect of tariff policy and competition that influence exports.
The September WASDE report confirmed that the 2025 corn crop will be harvested from an expanded 90.0 million acres, (82.7 million acres in 2024). The soybean crop will be harvested from a reduced 80.3 million acres, (86.3 million acres in 2024).
The September WASDE yield value for the 2025 corn crop was predicted at 186.7 bushels per acre, down 1.1 percent from 188.8 bushels per acre noted in August. By comparison yield was 183.1 bushels per acre in 2024. The projected value for soybean yield was an optimistic 53.5 bushels per acre down 0.2 percent from August. By comparison yield was 51.7 bushels per acre for the previous 2024 crop.
As of September 7th the USDA Crop Progress Report documented 95 percent of the corn crop had attained the dent stage, 25 percent was mature and 4 percent had been harvested. With respect to condition, 65 percent was classified as “good” or “excellent” combined, compared to 64 percent for the corresponding week in 2024. The September 8th Report confirmed that 97 percent of the soybean crop had set pods and 21 percent was dropping leaves. With respect to condition, 64 percent was classified as “good” or “excellent” combined, compared to 65 percent for the corresponding week in 2024.
The September WASDE projection for the ending stock of corn was reduced 0.3 percent from August to 2,110 million bushels. The September USDA projection for the ending stock of soybeans was up 3.4 percent from August to 300 million bushels due to increased supply and lower exports.
The September WASDE projected the corn price for the 2025-2026 market year at an average of 390 cents per bushel. The projected average season price for soybeans was reduced 10 cents to 1,000 cents per bushel. The price of soybean meal was unchanged from August at $280 per ton. USDA commodity prices suggest stable to lower feed costs for livestock and poultry producers. Row crop farmers and especially corn growers will experience declining margins. In some areas corn will be below break-even given relative production costs and per bushel prices. It is probable that high support prices will be required if importing nations respond negatively to tariffs proposed by the Administration.
Projections for world output included in the September 2025 WASDE report, reflect the most recent estimates for the production and export of commodities especially in the Southern Hemisphere with an emphasis on Argentine and Brazil. Economists also considered the impact of weather patterns arising from the La Nina event especially on South America.
It is accepted that USDA projections for export will be influenced by the fluid situation relating to tariffs. Exports are also based on the perceived intentions and needs of China. This Nation has sharply curtailed purchases of commodities and especially U.S. soybeans during the 2024-2025 and current market year.
CORN
Production parameters for corn were updated from the August WASDE, influenced by data on crop progress, actual acreage planted and trade figures. The September WASDE Report projected a 2025 crop of 16,815 million bushels, compared to 15,413 million bushels for the previous 2024 record harvest. The “Feed and Residual” category was unchanged from August to 6,100 million bushels. The Food and Seed category was projected at 1,380 million bushels. The Ethanol and Byproducts Category was retained at 5,600 million bushels consistent with estimated demand for E-10 and higher blends for driving needs in fall months. Projected corn exports were raised 3.5 percent to 2,975 million bushels, based on recent orders and shipments. The anticipated ending stock of corn will be 2,110 million bushels or 11.6 percent of projected availability.
The forecast USDA average season farm price for corn in the September WASDE report was 390 cents per bushel. At 16H00 EDT on September 12th after the noon release of the WASDE, the CME spot price for corn was 428 cents per bushel, 9.7 percent above the USDA projection and 8.6 percent above the August 12th CME price.
SEPTEMBER 2025 WASDE #664 Projections for the 2025 Corn Harvest:
|
Harvest Area
|
90.0 million acres
|
(98.7 m. acres planted, with harvest corresponding to 91.2% of acres planted)
|
|
Yield
|
186.7 bushels per acre
|
(Updated from 188.8 bushels per acre in the Aug. WASDE)
|
|
Beginning Stocks
|
1,325 m. bushels
|
|
|
Production
|
16,815 m. bushels
|
|
|
Imports
|
25 m. bushels
|
|
|
Total Supply
|
18,165 m. bushels
|
Proportion of Supply
|
|
Feed & Residual
|
6,100 m. bushels
|
33.6%
|
|
Food & Seed
|
1,380 m bushels
|
7.6%
|
|
Ethanol & Byproducts
|
5,600 m. bushels
|
30.8%
|
|
Domestic Use
|
13,080 m. bushels
|
72.0%
|
|
Exports
|
2,975 m. bushels
|
16.4%
|
|
Ending Stocks
|
2,110 m. bushels
|
11.6%
|
Average Farm Price: 390 cents per bushel. (unchanged from August WASDE)
SOYBEANS
Production parameters for soybeans were updated from the August WASDE, influenced by crop progress data and acreage planted. The September WASDE Report projected a 2025 yield of 53.5 bushels per acre but with reduced acreage planted compared to 2024. The September WASDE projected the soybean crop to be 4,301 million bushels. Crush volume was increased only 0.6 percent from August to 2,555 million bushels despite recently increased industry capacity. Projected exports were reduced 1.2 percent to 1,685 million bushels based on the prospect of reduced imports by China following uncertainty over tariffs and diplomatic conflict. Ending stocks were anticipated to be 300 million bushels, up 3.5 percent from the August WASDE. Prior to 2018, China, the largest trading partner for U.S. agricultural commodities, imported the equivalent of 25 percent of U.S. soybeans harvested.
The USDA WASDE September projection for the ex-farm price for soybeans was reduced 10 cents per bushel from August to 1,000 cents per bushel. At 16H00 EDT on September 12th following release of the WASDE, the CME spot price was 1,045 cents per bushel, 4.5 percent above the September USDA projection and 1.3 percent above the August 12th CME price.
SEPTEMBER 2025 WASDE #664 Projection for the 2025 Soybean Harvest:-
|
Harvest Area
|
80.3 million acres
|
81.1 m. acres planted. Harvest corresponding to 99.0% of planted acreage)
|
|
Yield
|
53.5 bushels per acre
|
(Updated from 53.6 bushels/acre in the Aug. WASDE)
|
|
Beginning Stocks
|
330 m. bushels
|
|
|
Production
|
4,301 m. bushels
|
|
|
Imports
|
20 m. bushels
|
|
|
Total Supply
|
4,651 m. bushels
|
Proportion of Supply
|
|
Crush Volume
|
2,555 m. bushels
|
54.9%
|
|
Exports
|
1,685 m. bushels
|
36.2%
|
|
Seed
|
73 m. bushels
|
1.6%
|
|
Residual
|
34 m. bushels
|
0.8%
|
|
Total Use
|
4,351 m. bushels
|
93.5%
|
|
Ending Stocks
|
300 m. bushels
|
6.5%
|
Average Farm Price: 1,000 cents per bushel (down 10 cents per bushel from August)
SOYBEAN MEAL
The projected parameters for soybean meal were adjusted from August. Production will attain 60.2 million tons, up 0.6 percent consistent with the 0.6 percent increased soybean crush volume of 2,555 million bushels. Projected production reflects the stagnant demand for biodiesel despite expanded U.S. crushing capacity. Crush volume is driven both by exports and domestic consumption for livestock feed and for soy oil supplying the food and biodiesel segments. The projection of domestic use was 41,675 million tons. Exports were estimated at 19.2 million tons.
The USDA projected the ex-plant price of soybean meal at $280 unchanged from the August WASDE as an average for the season based on supply and demand considerations. USDA predicted an ending stock of 475,000 tons representing 0.8 percent of supply.
At 16H00 EDT on September 12th the CME spot price for soybean meal was $288 per ton, up 2.9 percent compared to the September WASDE projection of $280 per ton and down 1.4 percent from the August CME price.
SEPTEMBER 2025 WASDE #664 Projection of Soybean Meal Production and Use
|
Beginning Stocks
|
450
|
|
Production
|
60,225
|
|
Imports
|
675
|
|
Total Supply
|
61,350
|
|
Domestic Use
|
41,675
|
|
Exports
|
19,200
|
|
Total Use
|
60,875
|
|
Ending Stocks
|
475
|
(Quantities in thousand short tons)
Average Price ex plant: $280 per ton )unchanged from August 2025)
IMPLICATIONS FOR PRODUCTION COST
The price projections based on CME quotations for corn and soybeans suggest lower feed production costs for broilers and eggs. Going forward, prices of commodities will be determined by World supply and demand and U.S. domestic yield, use and exports.
For each 10 cents per bushel change in corn:-
- The cost of egg production would change by 0.45 cent per dozen
- The cost of broiler production would change by 0.25 cent per live pound
For each $10 per ton change in the cost of soybean meal:-
- The cost of egg production would change by 0.35 cent per doze
- The cost of broiler production would change by 0.30 cent per live pound.
WORLD SITUATION
With respect to world coarse grains and oilseeds the August 2025 WASDE Report included the following appraisals by USDA:-
COARSE GRAINS:
“Global coarse grain production for 2025/26 is forecast 24.9 million tons higher to 1.572 billion.
This month’s 2025/26 foreign coarse grain outlook is for lower production, trade, and ending
stocks relative to last month. Foreign corn production is down reflecting cuts to the EU and
Serbia that are partially offset by increases for Ukraine and Canada. For the EU and Serbia
extreme heat and dryness in southeastern Europe during the month of July reduces yield
prospects. Area is also lowered for the EU. Ukraine production is raised on greater area. Canada
is higher reflecting an increase in yield expectations. Foreign barley production for 2025/26 is
reduced with a decline for Uruguay”.
“Major global coarse grain trade changes for 2025/26 include higher corn exports for the United
States and Ukraine but reductions for Serbia and the EU. Corn imports are raised for Mexico, the
EU, Egypt, Colombia, and Turkey but lowered for Canada. Foreign corn ending stocks are down,
reflecting declines for China, Indonesia, and the EU that are partly offset by increases for
Ukraine and Egypt. Global corn stocks, at 282.6 million tons, are up 10.4 million”.
OILSEEDS:
“Global 2025/26 oilseed production is lowered 3.3 million tons to 690.1 million mainly on lower
soybean, sunflower seed, and cottonseed production. Global sunflower seed production is
lowered 1.2 million tons to 55.1 million on hot and dry weather conditions leading to lower yields for the EU, Ukraine, Turkey, and Serbia”.
“Global soybean supply and demand forecasts for 2025/26 include lower production, exports, and ending stocks. Global production for 2025/26 is lowered mainly on lower production for the
United States and Serbia. Exports are reduced for the United States but raised for Argentina and
Uruguay. Imports are reduced for the EU, Iran, and Vietnam. Global ending stocks are reduced
1.2 million tons to 124.9 million on lower stocks for Argentina, the EU, Iran, Vietnam, and the
United States.”
World and U.S. Data Combined for Coarse Grains and Oilseeds:-
|
Factor: Million m. tons
|
Coarse Grains
|
Oilseeds
|
|
Output
|
1,573*
|
692
|
|
Supply
|
1,886
|
835
|
|
World Trade
|
245
|
214
|
|
Use
|
1,576
|
580
|
|
Ending Stocks
|
310
|
145
|
*Values rounded to one million metric ton
(1 metric ton corn= 39.37 bushels. 1 metric ton of soybeans = 36.74 bushels)
(“ton” represents 2,000 pounds)
|
Trade in Shell Eggs and Products, January through July 2025.
|
09/06/2025 |
|
The volume of exports of shell eggs and products is conditioned by the domestic needs of importers, price against competitors and regulatory disease and logistic restraints. Imports are determined by domestic needs with reduced supply due to flock depopulation as the principal driving factor during the 1st Quarter of 2025.
USAPEEC data reflecting volume of exports for shell eggs and egg products are shown in the table below comparing 2024 with 2025:-
|
PRODUCT
|
Jan.-July 2024
|
Jan.-July 2025
|
Difference
|
|
Shell Eggs
|
|
|
|
|
Volume (m. dozen)
|
45.6
|
44.0*
|
-1.6 (-3.5%)
|
|
Value ($ million)
|
94.5
|
213.6
|
+119.1 (+126%)
|
|
Unit Value ($/dozen)
|
2.07
|
4.85
|
+2.78 (+134%)
|
|
Egg Products
|
|
|
|
|
Volume (metric tons)
|
16,162
|
11,406
|
-4,756 (-29.4%)
|
|
Value ($ million)
|
71.9
|
63.4
|
-8.5 (-11.8%)
|
|
Unit Value ($/metric ton)
|
4,448
|
5,558
|
+1,110 (+25.0%)
|
U.S. EXPORTS OF SHELL EGG AND EGG PRODUCTS DURING
JANUARY-JULY INCLUSIVE IN 2025 COMPARED WITH 2024
*The data published by USDA for shell eggs are slightly different from USAPEEC figures included in this table.
For the seven-month period Canada was the export destination of 72.0 percent of U.S. shell eggs followed by the Caribbean at 19.1 percent. For egg products the four major importers collectively comprised 78.4 percent of volume with the relative proportions represented by Japan (25.2%); Canada, (20.4%), Mexico, (16.6%) and the EU, (16.2%).
According to the USDA Egg Markets Overview, September 6th, shell eggs exported attained 38.4 million dozen. All egg products including liquid and dried, attained 34.8 million dozen shell equivalents for a total of 73.2 million dozen shell equivalents over seven months. Imports over the same period comprised 58.5 million dozen shell eggs for breaking and 30.2 million dozen shell egg equivalents over all product forms for a total of 88.7 million dozen shell equivalents
Net trade deficit was therefore 15.5 million dozen shell equivalents
The trade situation will be influenced by tariff policy and the needs of importers during the remaining four months of 2025. Since supply will hopefully improve in volume, imports will be curtailed with an expectation of higher exports consistent with more competitive prices.
|
U.S Egg Industry-By the Numbers
|
07/22/2025 |
|
The following production data was summarized from the July 21st 2025 edition of the USDA Chickens and Eggs-:
June 2025 pullet hatch, 29.7 million, up 14 percent from June 2024.
January to June 2025 cumulative pullet hatch, 177.9 million, up 9 percent from first half of 2025
July 1st 2025 egg-type hatching eggs in incubators, 57.3 million, up 14 percent from July 1st 2024
June 2025 pullets placed, 28.3 million, up 6 percent from June 2024
June 2025 pullets undergoing rearing, 129.4 million, up 2 percent from June 2024.
July 1st 2025 hen population 288.1 million, down 5 percent from July 2024.
June 2025 table eggs produced, 7,074 billion, down 6 percent from June 2024.
July 1st 2025 hens in molt, 2.1% of flock, up 17 percent from July 2024.
July 1st 2025 hens completed molt, 9.8% of flock, up 4 percent from July 2024.
June 2025 disposal by slaughter, 12.6 million, up 6 percent from June 2024
June 2025 disposal by rendering, composting or death, 8.3 million, up 48 percent from June 2024.
The take-away from July data is the initiation of a replacement of the national flock that was reduced by depopulation of 39 million hens during the first five months of 2025. It is probable that the quantum of replacements will be consistent with anticipated demand, avoiding oversupply and depressed prices as recorded in 2016 and early 2023. If mortality due to HPAI returns during the fall migration of waterfowl or if extension of infection from dairy herds occurs, growth in the national flock will be impacted.
|
Updated USDA-ERS Poultry Meat Projection
|
06/03/2025 |
|
On June 18th 2024 the USDA-Economic Research Service released updated production and consumption data with respect to broilers and turkeys, covering 2024, a projection for 2025 and a forecast for 2026.
The 2025 projection for broiler production is for 47,500 million lbs. (21.591 million metric tons) up 1.2 percent from 2024. USDA projected per capita consumption of 101.9 lbs. (46.3 kg.) for 2025, up 0.9 percent from 2024. Exports will attain 6,588 million lbs. (2.995 million metric tons), 2.0 percent below the previous year.
The 2026 USDA forecast for broiler production will be 48,100 million lbs. (21.864 million metric tons) up 1.1 percent from 2025 with per capita consumption up 0.7 lb. to 102.6 lbs. (46.6 kg). Exports will be 1.2 percent higher compared to 2025 at 6,670 million lbs. (3.031 million metric tons), equivalent to 14.5 percent of production.
Production values for the broiler and turkey segments of the U.S. poultry meat industry are tabulated below:-
|
Parameter
|
2024
(actual)
|
2025
(projection)
|
2026
(forecast)
|
Difference
2024 to 2025
|
|
Broilers
|
|
|
|
|
|
Production (million lbs.)
|
46,994
|
47,580
|
48,100
|
+1.2
|
|
Consumption (lbs. per capita)
|
101.0
|
101.9
|
102.6
|
+0.9
|
|
Exports (million lbs.)
|
6,724
|
6,588
|
6,670
|
-2.0
|
|
Proportion of production (%)
|
14.3
|
13.8
|
13.9
|
-3.5
|
|
|
|
|
|
|
|
Turkeys
|
|
|
|
|
|
Production (million lbs.)
|
5,121
|
4,806
|
5,080
|
-6.2
|
|
Consumption (lbs. per capita)
|
13.8
|
13.0
|
13.5
|
-5.8
|
|
Exports (million lbs.)
|
486
|
405
|
435
|
-16.7
|
|
Proportion of production (%)
|
9.5
|
8.4
|
8.6
|
-11.6
|
Source: Livestock, Dairy and Poultry Outlook released June 18th 2025
The June USDA report updated projection for the turkey industry for 2025 including annual production of 4,806 million lbs. (2.185 million metric tons), down 6.2 percent from 2024. Consumption in 2025 is projected to be 13.0 lbs. (5.9 kg.) per capita, down proportionately by 5.8 percent from the previous year. Export volume will attain 405 million lbs. (184,090 metric tons) in 2025. Values for production and consumption of RTC turkey in 2025 are considered to be realistic, given year to date data, the prevailing economy, variable weekly poult placements, production levels, reduced losses from HPAI and inventories consistent with season.
The 2026 forecast for turkey production is 5,080 million lbs. (2.309 million metric tons) up an optimistic 5.7 percent from 2025 with per capita consumption up an unsubstantiated 3.8 percent to 13.5 lbs. (6.1 kg). Exports will be 19.7 percent higher than in 2025 to 435 million lbs. (197,728 metric tons) equivalent to 8.6 percent of production.
Export projections do not allow for a breakdown in trade relations with existing major partners including Mexico, Canada and China nor the impact of catastrophic diseases including HPAI and vvND in either the U.S. or importing nations
|
Trade in Shell Eggs and Products, Q1, 2025
|
05/14/2025 |
|
The volume of exports of shell eggs is conditioned by the domestic needs of importers, price against competitors and regulatory disease and logistic restraints. Imports are determined by domestic needs with reduced supply due to flock depopulation as the principal driving factor.
USDA-FAS data reflecting volume of exports for shell eggs and egg products are shown in the table below comparing 2024 with 2025:-
|
PRODUCT
|
Jan.-March. 2024
|
Jan.-March. 2025
|
Difference
|
|
Shell Eggs
|
|
|
|
|
Volume (m. dozen)
|
21.8
|
24.0
|
+2.5 (+11.5%)
|
|
Value ($ million)
|
43.4
|
152.2
|
+108.8 (+250%)
|
|
Unit Value ($/dozen)
|
1.99
|
6.34
|
+4.35 (+219%)
|
|
Egg Products
|
|
|
|
|
Volume (metric tons)
|
7,369
|
4,780
|
-2,589 (-35.1%)
|
|
Value ($ million)
|
35.1
|
25.9
|
-9.2 (-25.6%)
|
|
Unit Value ($/metric ton)
|
4,763
|
5,418
|
+655 (+13.8%)
|
U.S. EXPORTS OF SHELL EGG AND EGG PRODUCTS DURING JANUARY-MARCH 2024 COMPARED WITH 2024
Due to a deficiency in domestic supply relative to demand, importation during January through March 2025 amounted to 25.5 million shell-equivalent dozens. Monthly totals amounted to 2.1 million in January, 11.5 million in February and 11.9 million in March. For the quarter, imports expressed as a percentage of the total, comprised shell eggs, 58.6; egg liquids, 9.8 and dried egg, 31.6. Total egg imports during calendar 2025 are projected by the USDA to attain 32 million dozen shell equivalents suggesting restoration of supply as 78 percent of the calculated total was imported during the first quarter of 2025. Naturally if HPAI emerges in the fall flock depopulation will resume and the U.S. will revert to the situation that prevailed in late 2024 extending into 2025.
During April 2025 Brazil claimed to have exported 3.9 million dozen eggs to the U.S. valued at $6.3 million representing an extremely low FOB unit price of $1.57 per dozen.
Given the export of 35.8 million dozen shell equivalents over the first quarter of 2025 net exports attained 10.3 million dozen shell equivalents.
The trade situation will be influenced during the second quarter of 2025 if tariffs are imposed by the U.S. with the inevitability of reciprocal action by importing nations. Since supply will hopefully improve in volume, imports will be curtailed with an expectation of higher exports consistent with more competitive prices.
|
USDA-WASDE REPORT #660, May 12th 2025
|
05/13/2025 |
|
OVERVIEW
 The USDA provided updated projections for the production of corn and soybeans in the May12thWorld Agriculture Supply and Demand Estimates (WASDE) #660, reflecting the 2025 crop. Production values for corn and soybeans were updated from previous edition. Projections of crop size and ending stocks are derived from acreage to be planted, recent annual crop yields and with the latest assumptions relating to domestic use and tariff policy influencing exports. The USDA provided updated projections for the production of corn and soybeans in the May12thWorld Agriculture Supply and Demand Estimates (WASDE) #660, reflecting the 2025 crop. Production values for corn and soybeans were updated from previous edition. Projections of crop size and ending stocks are derived from acreage to be planted, recent annual crop yields and with the latest assumptions relating to domestic use and tariff policy influencing exports.
The May 12th WASDE report confirmed that the 2025 corn crop will be harvested from an expanded 87.4 million acres, (82.7 million acres in 2024). The soybean crop will be harvested from a reduced 82.7 million acres, (86.3 million acres in 2024).
The May WASDE yield value for the 2025 corn crop was predicted at 181.0 bushels per acre. By comparison yield was 183.1 bushels per acre in 2024. The projected value for soybean yield was an optimistic 52.5 bushels per acre compared to 51.7 bushels per acre for the previous crop.

The May USDA projection for the ending stock of corn was 2024 to 1,800 million bushels. The May USDA projection for the ending stock of soybeans was 295 million bushels.
The May 2024 WASDE projected the corn price for the 2025-2026 market year at an average of 420 cents per bushel. The projected average season price for soybeans was 1,025 cents per bushel. The price of soybean meal was projected to be $310 per ton. USDA commodity prices suggest stable to lower feed costs for livestock and poultry producers. Row crop farmers will experience declining margins. In some areas corn will be below break-even given relative production costs and per bushel prices. It is probable that high support prices will be required if importing nations respond negatively to tariffs proposed by the Administration.
Projections for world output included in the May 2025 WASDE report, reflect the most recent estimates for the production and export of commodities especially in the Southern Hemisphere with emphasis on Argentine and Brazil. Economists also evaluated the likely impacts from the transition to a La Nina event especially on South America.
It is accepted that USDA projections for export will be influenced by the fluid situation relating to tariffs. Exports are also based on the perceived intentions and needs of China. This Nation has sharply curtailed purchases of commodities and especially U.S. soybeans during the previous and current market year.
CORN
Influenced by harvest data for the 2024 corn crop, estimated yield and acreage to be planted, the May WASDE Report projected a 2025 crop of 15,820 million bushels, compared to 15,413 million bushels for the previous 2024 record harvest. The “Feed and Residual” category was estimated at 5,900 million bushels. The Food and Seed category was projected at 1,385 million bushels. The Ethanol and Byproducts Category was held at 5,500 million bushels consistent with estimated demand for E-10 and higher blends for driving needs. Projected corn exports were predicted to attain 2,675 million bushels, based on recent orders and shipments. The anticipated ending stock of corn will be 1,800 million bushels or 10.4 percent of projected availability.
The forecast USDA average season farm price for corn in the May WASDE report covering the 2025 crop was 420 cents per bushel. At 13H00 EDT on March 13th after the noon release of the WASDE the previous day, the CME spot price for corn was 440 cents per bushel, up 4.8 percent from the USDA May projection.
MAY 2025 WASDE #660 Projections for the 2025 Corn Harvest:
|
Harvest Area
|
87.4 m acres
|
(95.3 m. acres planted), harvest corresponding to 91.7% of acres planted)
|
|
Yield
|
181.0 bushels per acre
|
(Updated from 179.3 bushels per acre in the February WASDE reflecting the 2024 crop)
|
|
Beginning Stocks
|
1,415 m. bushels
|
|
|
Production
|
15,820 m. bushels
|
|
|
Imports
|
25 m. bushels
|
|
|
Total Supply
|
17,260 m. bushels
|
Proportion of Supply
|
|
Feed & Residual
|
5,900 m. bushels
|
34.3%
|
|
Food & Seed
|
1,385 m bushels
|
8.0%
|
|
Ethanol & Byproducts
|
5,500 m. bushels
|
31.8%
|
|
Domestic Use
|
12,785m. bushels
|
74.1%
|
|
Exports
|
2,675 m. bushels
|
15.5%
|
|
Ending Stocks
|
1,800 m. bushels
|
10.4%
|
Average Farm Price: 420 cents per bushel.
SOYBEANS
Influenced by harvest data for the 2024 corn crop and an estimated yield of 52.5 bushels per acre but with reduced acreage to be planted, the May WASDE Report projected the soybean crop to be 4,340 million bushels harvested. Crush volume was projected at 2,490 million bushels despite increased industry capacity. Projected exports were predicted to be 1,815 million bushels notwithstanding the prospect of reduced imports by China following uncertainty over tariffs. Ending stocks were anticipated to be 295 million bushels, down 22.3 percent from the December WASDE report reflecting the 2024-2025 season. Prior to 2018, China, the largest trading partner for U.S. agricultural commodities, imported the equivalent of 25 percent of U.S. soybeans harvested.
The USDA WASDE May projection for the ex-farm price for soybeans for the 2025 harvest was 1,025 cents per bushel. At 13H00 EDT on May 13th following release of the WASDE, the CME spot price was 1,072 cents per bushel, 4.6 percent above the May USDA projection.
May 2025 WASDE #660 Projection for the 2025 Soybean Harvest:-
|
Harvest Area
|
82.7 m acres
|
83.5 m. acres planted. Harvest corresponding to 99.0% of planted acreage)
|
|
Yield
|
52.5 bushels per acre
|
(Up from 51.7 bushel/acre attained in 2024)
|
|
Beginning Stocks
|
350 m. bushels
|
|
|
Production
|
4,340 m. bushels
|
|
|
Imports
|
20 m. bushels
|
|
|
Total Supply
|
4,710 m. bushels
|
Proportion of Supply
|
|
Crush Volume
|
2,490 m. bushels
|
52.9%
|
|
Exports
|
1,815 m. bushels
|
38.5%
|
|
Seed
|
73 m. bushels
|
1.5%
|
|
Residual
|
37 m. bushels
|
0.8%
|
|
Total Use
|
4,415 m. bushels
|
93.7%
|
|
Ending Stocks
|
295 m. bushels
|
6.3%
|
Average Farm Price: 1,025 cents per bushel
SOYBEAN MEAL
The projected production of soybean meal from the 2025 soybean crop will be 58.7 million tons, consistent with the soybean crush volume of 2,490 million bushels. Projected production reflects the stagnant demand for biodiesel despite expanded U.S. crushing capacity. Crush volume is driven both by exports and domestic consumption for livestock feed and for soy oil supplying the food and biodiesel segments. The projection of domestic use was 41,325 million tons. Exports were estimated at 18.0 million tons.
The USDA projected the ex-plant price of soybean meal at $310 is unchanged since the February WASDE as an average for the season based on supply and demand considerations. USDA predicted an ending stock of 475,000 tons representing 0.8 percent of supply.
At 13H00 EDT on February 13th the CME spot price for soybean meal was $293 per ton, down 5.5 percent compared to the May WASDE projection of $310 per ton.
MAY 2025 WASDE #660 Projection of Soybean Meal Production and Use
|
Beginning Stocks
|
450
|
|
Production
|
58,700
|
|
Imports
|
650
|
|
Total Supply
|
59,800
|
|
Domestic Use
|
41,325
|
|
Exports
|
18,000
|
|
Total Use
|
59,325
|
|
Ending Stocks
|
475
|
(Quantities in thousand short tons)
Average Price ex plant:$310 per ton
IMPLICATIONS FOR PRODUCTION COST
The price projections based on CME quotations for corn and soybeans suggest lower feed production costs for broilers and eggs. Going forward, prices of commodities will be determined by World supply and demand and U.S. domestic yield, use and exports.
For each 10 cents per bushel change in corn:-
- The cost of egg production would change by 0.45 cent per dozen
- The cost of broiler production would change by 0.25 cent per live pound
For each $10 per ton change in the cost of soybean meal:-
- The cost of egg production would change by 0.35 cent per doze
- The cost of broiler production would change by 0.30 cent per live pound.
WORLD SITUATION
With respect to world coarse grains and oilseeds the May 2025 WASDE Report included the following appraisals by USDA:-

COARSE GRAINS:
“The 2025/26 global coarse grain outlook is for record production and consumption and a decline in ending stocks. World corn production is forecast to rise to a record 1.265 billion metric tons, with the largest increases for the United States, Ukraine, and Argentina. Partly offsetting are smaller crops projected for Tanzania and Canada. Larger area expectations drive an increase in corn production for Argentina, while a return to trend yield and higher area boosts production prospects for Ukraine. For Brazil, expansion in corn area drives larger crop prospects. World barley, sorghum, millet, mixed grain, and rye production are forecast higher than a year ago, while oat production is down slightly”.
“World corn consumption is expected to rise two percent to a record 1.274 billion metric tons, with consumption exceeding production for the second consecutive year. World corn imports are forecast to rise one percent, driven by increases for several countries, including China, Vietnam, the EU, Venezuela, and Iran. Partly offsetting are declines for Zimbabwe, Zambia, and Turkey”.
“Global corn ending stocks for 2025/26 are down 9.5 million tons to 277.8 million tons which if realized would be the lowest since 2013/14. For 2025/26, stocks in the major exporting countries of Argentina, Brazil, Russia, Ukraine, and the United States are projected to rise, mostly reflecting an increase for the United States partly offset by a decline for Brazil.
For China, total coarse grain imports for 2025/26 are forecast at 28.5 million tons, up 6.5 million from a year ago but below the record 50.5 million reached during 2020/21. Corn imports are projected up 2.0 million tons to 10.0 million, while sorghum is up 4.0 million to 8.5 million. Barley imports are up 0.5 million”.

OILSEEDS:
“Global 2025/26 soybean crush is growing three percent to 366.5 million tons, with most of the growth for China, the United States, Brazil, Egypt, Pakistan, Argentina, Bangladesh, Thailand, and Vietnam. Overall, the highest growth in oilseed meal exports is soybean meal for the United States and Argentina and sunflower seed meal for Ukraine. Global vegetable oil exports are rising three percent on higher palm oil exports for Indonesia, Malaysia, and Thailand and higher sunflower seed oil exports for Ukraine and Turkey. Global vegetable oil stocks are flat with the prior year”.
“Global soybean exports for 2025/26 are expected to increase four percent to 188.4 million tons from 2024/25. Exports of major South American soybean-producing countries (Brazil, Argentina, Paraguay and Uruguay) are expected to rise 8.5 million tons, more than offsetting lower U.S. exports. Global imports are increased for Argentina on higher supplies in neighboring countries and in China, Egypt, Pakistan, Bangladesh, Vietnam, Mexico, and Algeria. Soybean imports for China are up 4 million tons the revised 2024/25 import forecast at 112 million. Global ending stocks are up 1.2 million tons to 124.3 million, mainly on higher stocks for Brazil and Argentina partly offset by lower U.S. stocks”.
World and U.S. Data Combined for Coarse Grains and Oilseeds:-
|
Factor: Million m. tons
|
Coarse Grains
|
Oilseeds
|
|
Output
|
1,549*
|
692
|
|
Supply
|
1,866
|
833
|
|
World Trade
|
238
|
215
|
|
Use
|
1,560
|
581
|
|
Ending Stocks
|
305
|
143
|
*Values rounded to one million metric ton
(1 metric ton corn= 39.37 bushels. 1 metric ton of soybeans = 36.74 bushels)
(“ton” represents 2,000 pounds)
|
USDA Cage-Free Production Data for April 2025
|
05/06/2025 |
|
This update of U.S cage-free production is sponsored by Big Dutchman USA for the benefit of producers in North America.
The USDA Cage-Free Report covering April 2025, was released on May 2nd 2025.
The report documented the complement of hens producing under the Certified Organic Program to be 20.4 million (rounded to 0.1 million), unchanged from March 2025. The number of hens classified as cage-free (but excluding Certified Organic) and comprising aviary, barn and other systems of housing apparently decreased by 0.1 million hens or 0.1 percent from March 2025 to 105.3 million.
Depopulation was carried out as a result of HPAI through the fourth quarter of 2024 and continuing in January and February 2025 (31 million) but with lower intensity in March (0.2 million) and April (1.0 million).
Average weekly production for Certified Organic eggs in April 2025 was down 0.1 percent compared to March 2025 with a questionably high average weekly production of 84.2 percent. Average weekly flock production for cage-free flocks other than Certified Organic was down 0.1 percent percent in April 2025, but with a high average hen-month production of 82.9 percent. Seasonally placed younger flocks in anticipation of periods of peak seasonal demand increase the availability of cage-free and organic eggs in response to pullet chick placements 20 weeks previously.
There is no adequate explanation for the high production rate especially if the reported number of hens is lower than actual, and in view of a possible undercount following HPAI flock depopulation.
According to the USDA Egg Markets Overview and data from the weekly USDA Shell Egg Demand Indicator for April 30th the categorization of U.S. flocks according to housing system among the total of 283 million producing hens on April 1st comprised:-
Caged, 157.3 million (55.7%);
Cage Free, 105.3 million (37.1%) with 87% in barns and 8% each on free-range and pasture;
Organic, 20.4 million (7.2%) with 90% in barns and 5.0% each on free-range and pasture:
Losses attributed to HPAI in 2025 to date comprised:-
Caged flocks, 20.3 million representing 7.1 percent of nominal hens in production
Cage-free flocks, 11.0 million representing 3.9 percent
Organic flocks, negligible, >0.1 percent
|
Average Flock Size
(million hens)
|
Average
Q1- 2025
|
Average
Q4-2024
|
Average
Q3- 2024
|
Average
Q2 –2024
|
Average
Q1 –2024
|
Average
Q4-2023
|
|
Certified Organic
|
20.4
|
20.5
|
20.0
|
18.8
|
18.3
|
18.7
|
|
Cage-Free Hens
|
103.4
|
104.5
|
103.9
|
101.0
|
105.7
|
106.4
|
|
Total Non-Caged
|
123.8
|
125.0
|
123.9
|
119.8
|
124.0
|
125.1
|
|
Average Weekly Production (cases of 360 eggs)
|
March 2025
|
April 2025
|
|
Certified Organic @ 84.2% hen/day
|
334,431
|
334,431 unchanged*
|
|
Cage-Free @ 82.9% hen/day
|
1,701,861
|
1,698,059 -0.2%
|
|
Total Non-Caged @ 83.1% hen/day
|
2,036,292
|
2,032,085 -0.2%
|
*Validity of this unchanged population questioned
On May 5th USDA recorded the following National inventory levels expressed in 30-dozen cases with the weekly change as a percentage of the total quantity of eggs:-
| Commodity shell eggs of all sizes. |
1,217,300 |
(+3.6%) |
| Commodity breaking stock. |
274,100 |
(-9.2%) |
| Specialty eggs. |
41,000 |
(-5.0%) |
| Certified organic eggs |
75,000 |
(-2.6%) |
| Cage Free eggs |
363,200 |
(+0.5%) |
|
Average Nest Run Contract Price Cage-Free
Brown and White combined
|
$1.70/doz. (Unchanged since July 2024)
|
|
April 2025 Range:
|
$1.35 to $2.35/doz. (unchanged since March 2023)
|
|
FOB Negotiated April price, grade-ready quality, loose nest-run. Price range $4.00 to $5.25 per dozen
|
Average April 2025 Value of $4.48/doz. ($5.37/doz. March 2025)
|
|
Average April 2025 advertised promotional National Retail Price C-F, Large White*
|
$7.99/doz. April 2025 (4 regions only)
(Brown was $4.99/doz. in March 2025)
|
|
USDA Based on 4 Regions, only 62 stores
NE, SE, MW & SC.
|
All regions, $7.99 /doz.
|
*March report listed only Brown, April report listed only White. All regions listed the same price
Negotiated nest-run grade-ready cage-free price for April 2025 averaged $4.48 per dozen, down $0.89 per dozen (16.6 percent) from $5.37 per dozen in March 2025, reflecting an imbalance between demand relative to supply.
The April 2025 advertised U.S. featured retail price for Large White cage-free eggs over only four regions (NE, SE, MW and SC.) was $7.99 per dozen. This compares with 153 stores offering cage-free Large Brown in March and reflects few promotions as the year has progressed, consistent with the high incidence rate of HPAI during January and February followed by a decline.
The recorded average wholesale price of $4.48 per dozen plus a provision of $0.60 cents per dozen for packaging, packing and transport, resulted in a theoretical price of $5.08 per dozen delivered to CDs. The average four-region advertised promotional retail price of $7.99 per dozen corresponds to a theoretical average retail margin of 57.2 percent (-16.4 percent last month for Large C-F brown) but with few promotions offered by limited number of stores featuring cage-free eggs. Margins are presumed higher for non-featured eggs including pastured and other specialty eggs at shelf prices attaining in excess of $9.00 per dozen in high-end supermarket chains. Retailers maximizing margins especially on Certified Organic, free-range and pastured categories restrict the volume of sales, ultimately disadvantageous to producers.
|
USDA Cage-Free Production Data for March 2025
|
04/06/2025 |
|
This update of U.S cage-free production is sponsored by Big Dutchman USA for the benefit of producers in North America
Depopulation was carried out as a result of HPAI through the fourth quarter of 2024 and continued through 2025 to date but with lower intensity in March. The USDA Cage-Free Report covering March 2025, released on April 1st 2025, documented the complement of hens producing under the Certified Organic Program to be 20.4 million (rounded to 0.1 million), down 0.1 million from February 2025. The number of hens classified as cage-free (but excluding Certified Organic) and comprising aviary, barn and other systems of housing apparently increased by 1.7 million hens or 1.6 percent from February 2025 to 105.4 million, with negligible flock depopulation of laying hens but with loss of pullets during the month.
Average weekly production for Certified Organic eggs in March 2025 was up 0.1 percent compared to February 2025 with a questionably high average weekly production of 84.3 percent. Average weekly flock production for cage-free flocks other than Certified Organic was up 2.1 percent in March 2025, but with a high average hen-month production of 83.0 percent, up from 82.7 percent. Seasonally, younger flocks increase the availability of cage-free and organic eggs in response to pullet chick placements 20 weeks previously, especially in anticipation of periods of peak seasonal demand.
According to the USDA Egg Markets Overview the categorization of U.S. flocks according to housing system among the total of 285 million hens on March 1st was:-
Caged, 159 million (55.9% of 285 million hens);
Cage Free, 105 million (37.0%) with 87% in barns and 8% each on free-range and pasture;
Organic, 20 million (7.2%) with 91% in barns and 4.5% each on free-range and pasture:
There is no adequate explanation for the high production rate especially if the reported number of hens is lower than actual, and in view of a possible undercount following HPAI flock depopulation.
Losses during Q1 of 2025 comprised:
Caged flocks, 19.3 million representing 6.8 percent of hen population
Cage-free flocks, 11.0 million representing 3.9 percent
Organic flocks, negligible, 0.1 percent
|
Average Flock Size
(million hens)
|
Average
Q1- 2025
|
Average
Q4-2024
|
Average
Q3- 2024
|
Average
Q2 –
2024
|
Average
Q1 –
2024
|
Average
Q4-
2023
|
|
Certified Organic
|
20.4
|
20.5
|
20.0
|
18.8
|
18.3
|
18.7
|
|
Cage-Free Hens
|
103.4
|
104.5
|
103.9
|
101.0
|
105.7
|
106.4
|
|
Total Non-Caged
|
123.8
|
125.0
|
123.9
|
119.8
|
124.0
|
125.1
|
|
Average Weekly Production (cases of 360 eggs)
|
February
2025
|
March
2025
|
|
Certified Organic @ 84.3% hen/day
|
334,032
|
334,431 +0.1%
|
|
Cage-Free @ 83.0% hen/day
|
1,667,336
|
1,701,861 +2.1%
|
|
Total Non-Caged @ 83.2% hen/day
|
2,001,398
|
2,036,292 +1.7%
|
|
Average Nest Run Contract Price Cage-Free Brown
|
$1.70/doz. (Unchanged since July 2024)
|
|
March 2025 Range:
|
$1.35 to $2.35/doz. (unchanged since March 2023)
|
|
FOB Negotiated March price, grade-ready quality, loose nest-run. Price range $4.50 to $8.00 per dozen
|
Average March 2025 Value of $5.37/doz. ($7.77/doz. February 2025)
|
|
Average March 2025 advertised promotional National Retail Price C-F, Large Brown
|
$4.99/doz. March 2025 (3 regions only)
(was $7.99/doz. in February 2025)
|
|
USDA Based on 3 Regions, only 153 stores
NW, SW, & SC. (was 62 stores offering promotions)
|
All regions, $4.99 /doz.
|
Negotiated nest-run grade-ready cage-free price for March 2025 averaged $5.37 per dozen, down 30.8 percent from $7.77 per dozen in February 2025, reflecting an imbalance between demand relative to supply. The March 2025 advertised U.S. featured retail price for cage-free eggs over only three regions (NW, SW and SC.) was $4.99 per dozen, apparently down 37.5 percent or $3.80 per dozen from February 2025 based on 153 stores. This compares with 62 stores in February and reflects few promotions as the year has progressed reflecting the incidence rate of HPAI during January and February.
The recorded average wholesale price of $5.37 per dozen plus a provision of $0.60 cents per dozen for packaging, packing and transport, results in a price of $5.97 per dozen delivered to CDs. The average three-region advertised promotional retail price of $4.99 per dozen corresponds to a theoretical average retail negative margin of -16.4 percent (-4.5 percent last month) for promotions offered by the few stores featuring cage-free eggs. Margins are presumed higher for non-featured eggs including pastured and other specialty eggs at shelf prices attaining in excess of $9.00 per dozen in high-end supermarket chains. Retailers maximizing margins especially on Certified Organic, free-range and pastured categories restrict the volume of sales, ultimately disadvantageous to producers.
|
USDA Data on Cage-Free Production for February 2025
|
03/06/2025 |
|
This update of U.S cage-free production is sponsored by Big Dutchman USA for the benefit of producers in North America
Depopulation was carried out as required through the fourth quarter of 2024 and has continued through 2025 to date as a result of HPAI. The USDA Cage-Free Report covering February 2025, released on March 3rd 2025, documented the complement of hens producing under the Certified Organic Program to be 20.5 million (rounded to 0.1 million), up 0.1 million from January 2025. The number of hens classified as cage-free (but excluding Certified Organic) and comprising aviary, barn and other systems of housing apparently increased by 2.7 million hens or 2.7 percent from January 2025 to 103.7 million, despite extensive flock depopulation during the month.
Average weekly production for Certified Organic eggs in February 2025 was up 1.1 percent compared to January 2025 with a questionably high average weekly production of 84.0 percent. Average weekly flock production for cage-free flocks other than Certified Organic was up 3.3 percent in February 2025, but with a high average hen-month production of 82.7 percent, up from 82.6 percent. Seasonally, younger flocks increase the availability of cage-free and organic eggs in response to pullet chick placements 20 weeks previously especially in anticipation of periods of peak seasonal demand.
According to the USDA Egg Markets Overview the categorization of flocks according to housing system among the total of 292 million hens on
February 1st was:-
Caged, 169 million (57.2% of 292 million hens on February 1st.);
Cage Free, 102 million (34.9%) with 87% in barns and 8% each on free-range and pasture;
Organic, 21 million (7.2%) with 5% each on free-range and pasture:
There is no adequate explanation for the high production rate especially if the reported number of hens is lower than actual, and in view of a possible undercount following HPAI flock depopulation.
|
Flock Size Average
(million hens)
|
February
2025
|
Average
Q4-2024
|
Average
Q3- 2024
|
Average
Q2 –
2024
|
Average
Q1 –
2024
|
Average
Q4-
2023
|
|
Certified Organic
|
20.5
|
20.5
|
20.0
|
18.8
|
18.3
|
18.7
|
|
Cage-Free Hens
|
103.7
|
104.5
|
103.9
|
101.0
|
105.7
|
106.4
|
|
Total Non-Caged
|
124.2
|
125.0
|
123.9
|
119.8
|
124.0
|
125.1
|
|
Average Weekly Production (cases of 360 eggs)
|
January
2025
|
February
2025
|
|
Certified Organic @ 83.8% hen/day
|
330,252
|
334,032 +1.1%
|
|
Cage-Free @ 82.6% hen/day
|
1,613,998
|
1,667,366 +3.3%
|
|
Total Non-Caged @ 82.8% hen/day
|
1,944,250
|
2,001,398 +2.9%
|
|
Average Nest Run Contract Price Cage-Free Brown
|
$1.70/doz. (Unchanged since July 2024)
|
|
February 2025 Range:
|
$1.35 to $2.35/doz. (unchanged since March 2023)
|
|
FOB Negotiated January price, grade-ready quality, loose nest-run. Price range $7.50 to $9.00 per dozen
|
Average February 2025 Value of $7.77/doz. ($7.24/doz. January 2025)
|
|
Average February 2025 Advertised promotional National Retail Price C-F, Large Brown
|
$7.99/doz. February 2025 (4 regions)
(was $2.88/doz. in January 2025)
|
|
USDA Based on 4 Regions, 62 stores
Only NE, SE, MW & SC. (was 133 stores offering promotions)
|
Each Region, $7.99 /doz.
|
Negotiated nest-run grade-ready cage-free price for February 2025 averaged $7.74 per dozen, up 6.9 percent from $7.24 per dozen in January 2025, reflecting an imbalance between demand relative to supply. The February 2025 advertised U.S. featured retail price for cage-free eggs over only four regions (NE, SE, MW & SC.) was $7.99 per dozen, apparently up $5.11 per dozen from January 2025 based on 62 stores. This compares with 133 stores in January and reflects fewer promotions as the year has progressed reflecting the ongoing incidence rate of HPAI.
The recorded average wholesale price of $7.77 per dozen plus a provision of 60 cents per dozen for packaging, packing and transport, results in a price of $8.37 per dozen delivered to CDs. The average four-region advertised retail price of $7.99 per dozen corresponds to a theoretical average retail negative margin of 4.8 percent (-172.4 percent last month) for promotions offered by the few stores featuring cage-free eggs. Margins are presumed higher for non-featured eggs including pastured and other specialty eggs at shelf prices attaining in excess of $9.00 per dozen in high-end supermarket chains. Retailers maximizing margins especially on Certified Organic, free-range and pastured categories restrict the volume of sales, ultimately disadvantageous to producers.
|
USDA-WASDE REPORT #657, February 11th 2025
|
02/11/2025 |
|
OVERVIEW
 The USDA provided updated projections for the production of corn and soybeans in the February 11th World Agriculture Supply and Demand Estimates (WASDE) #657, projecting the 2025 crop. Production values for corn and soybeans were predictably little changed from from the January 2025 edition. Projections of crop size and ending stocks are derived from acreage to be planted, history of recent crops and with the latest assumptions relating to domestic use and exports. The USDA provided updated projections for the production of corn and soybeans in the February 11th World Agriculture Supply and Demand Estimates (WASDE) #657, projecting the 2025 crop. Production values for corn and soybeans were predictably little changed from from the January 2025 edition. Projections of crop size and ending stocks are derived from acreage to be planted, history of recent crops and with the latest assumptions relating to domestic use and exports.
The February 11th WASDE report confirmed that the 2025 corn crop will be harvested from 82.9 million acres, (82.7 million acres in 2024). The soybean crop will be harvested from 86.1 million acres, (86.3 million acres in 2024).
 The February WASDE yield value for the 2025 corn crop was predicted at 179.3 bushels per acre. By comparison yield was 183.1 bushels per acre in 2024. The projected value for soybean yield was 50.3 bushels per acre compared to 51.7 bushels per acre for the previous crop. The February WASDE yield value for the 2025 corn crop was predicted at 179.3 bushels per acre. By comparison yield was 183.1 bushels per acre in 2024. The projected value for soybean yield was 50.3 bushels per acre compared to 51.7 bushels per acre for the previous crop.
The February USDA projection for the ending stock of corn was down 11.4 percent from December 2024 to 1,540 million bushels. The February USDA projection for the ending stock of soybeans was down 19.2 percent to 380 million bushels.
The February 2024 WASDE projected the corn price for the 2024-2025 market year at an average of 435 cents per bushel. The projected average season price for soybeans was 1,010 cents per bushel. The price of soybean meal was projected to be $310 per ton. Projected commodity prices suggest lower feed costs for livestock and poultry producers. Row crop farmers will experience declining margins or in some areas corn will be below break-even given relative production costs and per bushel prices. It is probable that high support prices will be required if importing nations respond negatively to tariffs proposed by the Administration.
Projections for world output included in the February 2025 WASDE report, reflect the most recent estimates for the production and export of commodities especially in the Southern Hemisphere with emphasis on Argentine and Brazil. Economists also evaluated the likely impacts from the transition to a La Nina event especially on South America. Hostilities are ongoing in Ukraine following extensive destruction of agricultural infrastructure by the Russian Federation. Production and hence exports of wheat, corn and sunflower from Ukraine will be reduced compared to pre-war averages.

It is accepted that USDA projections for export are also based on the perceived intentions and needs of China. This Nation has sharply curtailed purchases of commodities and especially U.S. soybeans during the current market year despite fiscal stimulus with a projected recovery of the Nation’s economy influencing consumer demand for food and fuel.
The USDA considers world weather patterns in developing projections including the effect of the transition to a La Nina event during the third quarter of 2024.
CORN
Influenced by harvest data for the 2024 corn crop, the 2025 estimated yield and acreage to be planted, the February WASDE Report projected a crop of 14,867 million bushels, compared to 15,413 million bushels for the previous 2024 record harvest. The “Feed and Residual” category was estimated at 5,775 million bushels. The Food and Seed category was unchanged from 2024 at 1,390 million bushels. The Ethanol and Byproducts Category was held at 5,500 million bushels consistent with estimated demand for E-10 and higher blends for driving needs. Projected corn exports were reduced to 2,450 million bushels, based on recent orders, and shipments to China and taking into account the anticipated lower availability of coarse grains from Eastern Europe and the output of producing nations in South America. The anticipated ending stock of corn will be 1,540 million bushels.
The forecast USDA average season farm price for corn in the February WASDE report covering the 2025 crop was 435 cents per bushel. At 16H00 EST on February 11th after the noon release of the WASDE the CME spot price for corn was 483 cents per bushel, up 6.1 percent from the quotation on December 10th and up 11.0 percent from the February USDA projection.
December 2025 WASDE #657 Projections For The 2025 Corn Harvest:
|
Harvest Area
|
82.9 m acres
|
(90.6 m. acres planted), harvest corresponding to 91.5% of acres planted)
|
|
Yield
|
179.3 bushels per acre
|
(Updated from 183.8 bushels per acre in the December WASDE reflecting the 2024 crop)
|
|
Beginning Stocks
|
1,763 m. bushels
|
|
|
Production
|
14,867 m. bushels
|
|
|
Imports
|
25 m. bushels
|
|
|
Total Supply
|
16,655 m. bushels
|
Proportion of Supply
|
|
Feed & Residual
|
5,775 m. bushels
|
34.7%
|
|
Food & Seed
|
1,390 m bushels
|
8.4%
|
|
Ethanol & Byproducts
|
5,500 m. bushels
|
33.0%
|
|
Domestic Use
|
12,666 m. bushels
|
76.1%
|
|
Exports
|
2,450 m. bushels
|
14.7%
|
|
Ending Stocks
|
1,540 m. bushels
|
9.2%
|
1 metric ton = 39.368 bushels
Average Farm Price: 435 cents per bushel.
SOYBEANS
Influenced by harvest data for the 2024 corn crop, the 2025 estimated yield and acreage to be planted, the February WASDE Report projected the soybean crop to be 4,366 million bushels, based on a yield of 50.7 bushels per acre from 86.1 million acres harvested. Crush volume was held from the December WASDE report at 2,410 million bushels despite increased industry capacity and a projected 0.4 percent increase in the output of soybean meal. Projected exports were maintained at 1,825 million bushels despite the prospect of reduced imports by China. Ending stocks were anticipated to be 380 million bushels, down 19.1 prtcent from the December WASDE report.
There is uncertainty over orders from China for the current market year. This is attributed to competition from Brazil and an assumption of lower requirements for animal feed due to restrictions on pork production by the Central Government of China. The response of China with respect to announced import and punitive tariffs that are predicted to have a negative impact with respect to volume exported and hence lower domestic U.S. prices. Prior to 2018, China, the largest trading partner for U.S. agricultural commodities, imported the equivalent of 25 percent of U.S. soybeans harvested.
The USDA WASDE February projection for the ex-farm price for soybeans for the 2025 harvest was 1,010 cents per bushel. At 16H00 EST on February 11th following release of the WASDE, the CME spot price was 1,044 cents per bushel, up 4.8 percent compared to the December 10th quotation and 3.3 percent above the February USDA projection.
February 2025 WASDE #657 Projection for the 2025 Soybean Harvest:-
|
Harvest Area
|
86.1 m acres
|
87.1 m. acres planted. Harvest corresponding to 98.9% of planted acreage)
|
|
Yield
|
50.7 bushels per acre
|
(Down from 51.7 bushel/acre attained in 2024)
|
|
Beginning Stocks
|
342 m. bushels
|
|
|
Production
|
4,336 m. bushels
|
|
|
Imports
|
20 m. bushels
|
|
|
Total Supply
|
4,729 m. bushels
|
Proportion of Supply
|
|
Crush Volume
|
2,410 m. bushels
|
51.0%
|
|
Exports
|
1,825 m. bushels
|
38.6%
|
|
Seed
|
78 m. bushels
|
1.7%
|
|
Residual
|
36 m. bushels
|
0.7%
|
|
Total Use
|
4,349 m. bushels
|
92.0%
|
|
Ending Stocks
|
380 m. bushels
|
8.0%
|
1 metric ton = 36.74 bushels
Average Farm Price: 1,010 cents per bushel
SOYBEAN MEAL
The projected production of soybean meal from the 2025 soybean crop will be 56.95 million tons, up 0.4 percent from the 2024 crop but inconsistent with the unchanged 2,410 million bushel projected soybean crush volume. Projected production reflects the stagnant demand for biodiesel despite expanded U.S. crushing capacity. Crush volume is driven both by exports and domestic consumption for livestock feed and for soy oil supplying the food and biodiesel segments. The projection of domestic use was 40,225 million tons. Exports were estimated at 17.40 million tons.
The USDA projected the ex plant price of soybean meal at $310 in the February WASDE as an average for the season based on supply and demand considerations. USDA predicted an unchanged ending stock of 450,000 tons representing 0.8 percent of supply.
At market close on February 11th the CME spot price for soybean meal was $297 per ton, down 1.4 percent compared to the December 10th CME quotation and 4.2 percent lower than the December WASDE projection of $310 per ton.
February 2025 WASDE #657 Projection of Soybean Meal Production and Use
|
Beginning Stocks
|
453
|
|
Production
|
56,947
|
|
Imports
|
675
|
|
Total Supply
|
58,075
|
|
Domestic Use
|
40,225
|
|
Exports
|
17,400
|
|
Total Use
|
57,625
|
|
Ending Stocks
|
450
|
(Quantities in thousand short tons)
Average Price ex plant: $310 per ton
IMPLICATIONS FOR PRODUCTION COST
The price projections based on CME quotations for corn and soybeans suggest lower feed production costs for broilers and eggs. Going forward, prices of commodities will be determined by World supply and demand and U.S. domestic yield, use and exports.
For each 10 cents per bushel change in corn:-
- The cost of egg production would change by 0.45 cent per dozen
- The cost of broiler production would change by 0.25 cent per live pound
For each $10 per ton change in the cost of soybean meal:-
- The cost of egg production would change by 0.35 cent per doze
- The cost of broiler production would change by 0.30 cent per live pound.
WORLD SITUATION
With respect to world coarse grains and oilseeds the February 2025 WASDE Report included the following appraisals by USDA:-
COARSE GRAINS:
“Global coarse grain production for 2024/25 is forecast 1.8 million tons lower to 1.492 billion. This month’s foreign coarse grain outlook is for reduced production, trade, and ending stocks. Foreign corn production is forecast down with declines for Argentina and Brazil. Production is reduced for Argentina reflecting a cut in yield, as heat and dryness during January and into early February reduce yield prospects for early-planted corn in key central growing areas. For Brazil, the corn production forecast is reduced as slow second-crop planting progress in the Center-West lowers yield prospects.
Major global trade changes for 2024/25 include smaller projected corn exports for Brazil, Ukraine, and South Africa. Corn imports are cut for China but raised for Vietnam and Chile. Foreign corn ending stocks are reduced reflecting a reduction for China. Global corn ending stocks, at 290.3 million tons, are down 3.0 million.”
OILSEEDS:
“Global 2024/25 soybean supply and use forecasts include lower production, higher use, and lower ending stocks. Production is reduced for Argentina and Paraguay due to persistent heat and dryness during January. Brazilian soybean production is unchanged at 169.0 million tons. Beneficial weather in the Center-West is boosting soybean prospects, but drier weather in the south accelerated soybean development at the expense of yields”.
“Global soybean crush is raised on higher crush for Brazil. The increase is driven by favorable crush margins, strong biofuel demand, and the pace of soybean meal exports to date. Partially offsetting is lower soybean crush and soybean meal exports for Paraguay on lower supplies. With negligible changes to soybean exports, global ending stocks are reduced 4.0 million tons to 124.3 million on lower stocks for Argentina and Brazil.”
World and U.S. Data Combined for Coarse Grains and Oilseeds:-
|
Factor: Million m. tons
|
Coarse Grains
|
Oilseeds
|
|
Output
|
1,499*
|
683
|
|
Supply
|
1,846
|
815
|
|
World Trade
|
232
|
207
|
|
Use
|
1,523
|
558
|
|
Ending Stocks
|
323
|
147
|
*Values rounded to one million metric ton
(1 metric ton corn= 39.37 bushels) (“ton” represents 2,000 pounds)
|
Egg Week
|
01/29/2025 |
|
Egg Price and Inventory Report, January 29th 2025.
Market Overview
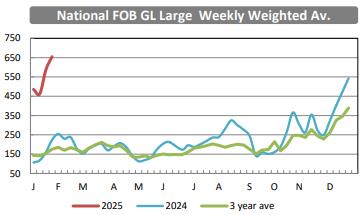
- The average wholesale unit revenue values for Midwest Extra-large and Large sizes were up 8.3 percent on average this past week. Medium size was up 8.3 percent. Medium size was up a substantial 30.8 percent. The 5-day rolling National wholesale price for graded loose on January 24th was $6.55 per dozen up $0.68 per dozen (+11.6 percent) from $5.88 last week. This value was approximately $4.05 above the 3-year average of 2.50 per dozen and $4.31 above the corresponding week in 2024 at $2.24 per dozen. Over the past week the NYC wholesale price in cartons was 7.7 percent higher and with the prospect of an increase during the coming week based on the trend of daily increases.
- The ex-farm price for breaking stock (rounded to one cent) was up 5.0 percent to $3.18 per dozen.Checks delivered to Midwest plants were up 8.4 percent to $3.22 per dozen this past week. Prices for breaking stock generally follow the wholesale price for shell eggs but with a lag of one to two weeks that may be reduced as in the present situation with diversion to the shell market.
- This past week shell egg inventory was down 2.0 percent, compared to a fall of 0.3 percent during the previous week. The fall in inventory with a large increase in wholesale price last week denotes sustained consumer demand relative to diminished supply. Fluctuation in inventory and price will occur through February based on the frequency and magnitude of orders by chains leading up to and beyond the unusual January surge in price intensified by ongoing 2025 losses due to HPAI. The national flock is down by a conservative estimate of 24 million hens at the present time, (with some depletions in progress)
- Although there are predetermined weekly transfers of mature pullet flocks to laying houses, the size of the producing flock is constrained by depopulation due to HPAI. Losses during 2024 attained approximately 40 million hens with the fall-winter wave in progress and with 2.6 million hens depopulated among four states in January 2025 to date.
- This past week, chains apparently widened the spread between delivered cost and shelf price. The reoccurrence of HPAI has probably created concern among chain buyers as they may previously have been reticent to place orders even with progressively increasing prices notwithstanding the need to ensure adequate stock levels to meet demand. Inventory levels this week reflected constant re-ordering to fill the pipeline. Discounters are raising prices on generics influencing mainstream retail stores. Eggs are now far less competitive in price against the comparable costs for other protein foods, and have recently been highlighted as a contributor to the prevailing perception among consumers of ongoing food inflation.
- Total industry inventory was down by 3.1 percent overall this past week to 1.43 million cases incorporating a 7.3 percent decrease in breaking stock, following a 1.3 percent fall during the preceding week.
- It is apparent that the inventory held by chains and other significant distributors may be more important on a weekly basis in establishing wholesale price compared to the USDA regional weekly inventory figures. Changes in stock held by DCs and through the pipeline as determined by orders is probably responsible for up to three percent cyclic fluctuation in weekly industry stock. This is especially evident into or after a holiday weekend or major storm as evidenced by fluctuation inventory levels over the past two months.
- The U.S. egg-production industry experienced the loss of 40 million hens during 2024 together with over 4 million replacement pullets. Ongoing reports of HPAI diagnoses in backyard and non-commercial flocks (‘non-WOAH reportable’) and isolation from free-living domestic non-migratory birds suggests a continuation of outbreaks until waterfowl settle into their winter habitat. Not even the most stringent biosecurity can absolutely prevent introduction of avian influenza virus on dust particles entrained in air entering complexes and houses with negative ventilation. This predicates the limited and strategic application of H5 vaccine in high-risk areas. Over 950 confirmed cases of bovine influenza-H5N1 have been diagnosed in dairy herds in sixteen states since March 2024 with most having recovered. More than 700 herds were diagnosed in California and 65 in Colorado over the past five months with the high incidence rate a function of mandatory surveillance of bulk milk. Bovine influenza-H5N1 is a cause for concern since extension to laying flocks has presumably occurred in Michigan, Colorado, California and Utah. More surveillance information should be released by USDA-APHIS as it becomes available, concerning the prevalence rate of avian carriers of H5N1 among resident domestic and migratory free-living birds. This data should be correlated with a review of molecular and field epidemiology for the past spring outbreaks in order to respond appropriately to the fall wave of HPAI in progress. The USDA has yet to identify and release specific modes of transmission for the 2022-2024 epornitic including an acknowledgement of the likely airborne spread from wild birds and their excreta over short distances as suggested by current research.
- The established relationship between producers and chain buyers based on a single commercial price discovery system constitutes an impediment to a free market. The benchmark price appears to amplify both downward and upward swings as evidenced over the past three years. A CME quotation based on Midwest Large, reflecting demand relative to supply would be more equitable. If feed cost is determined by CME ingredient prices then generic shell eggs should be subject to a Midwest Large quotation.
- On January 29th the stated total flock of 300.5 million, was down by 1.0 million from last week, including about one million molted hens that will resume lay during coming weeks plus 4.5 to 5.0 million pullets per week that entered production to satisfy current demand. Given the latest figures for depopulation in Missouri, Ohio and California, and considering USDA-APHIS reports of depopulation, it is estimated that the total egg-producing flock at the end of January 2025 is approximately 26 million hens lower (-8.0 percent) than the 326 million before the onset of HPAI in 2022.
The Week in Review
Prices
According to the USDA Egg Market News Reports, released on January 27th 2024, the Midwest wholesale price (rounded to one cent) for Extra-large was up 8.3 percent from last week to $7.04 per dozen. Large size was up 9.3 percent to $7.02 per dozen. Mediums were up 30.8 percent to $5.73 per dozen delivered to DCs. Continued increases are expected in the present week and extending through February
The stock of Medium size was down 5.4 percent, (down 13.6 percent in the Southwest Region but up 12.8 percent in the Southeast). The inventory of Small size was down 5.5 percent over the past week (South Central up 130 percent but Southwest down 45.8 percent). This indicates differences in timing of chick placements and regional demand. Surviving pullets placed in early September 2024 for mid-January 2025 production are now moving from Medium to Large. There is increased institutional demand for Medium size and some consumers are opting for smaller eggs based on price sensitivity.
Prices should be compared to the USDA benchmark average 4-Region blended nest-run cost of 74.4 cents per dozen as determined by the Egg Industry Center based on USDA data for December 2024. This value excludes provisions for packing, packaging materials and transport, amounting to 60 cents per dozen as determined in mid-2023 from an EIC survey (with a low response).
Currently producers of generic shell eggs are operating with very strong positive margins irrespective of region and customer-supply agreements. The progression of prices for loose eggs during 2023 and 2024 to date is depicted in the USDA chart reflecting three years of data, updated weekly.
The January 27th edition of the USDA Egg Market News Report confirmed that the USDA Combined Region value in cartons (rounded to the nearest cent), was up 61.0 percent to $6.67 per dozen delivered to warehouses one week ago. The USDA Combined range for Large in the Midwest was $6.48 per dozen. At the high end of the range, the price in the South Central region attained $6.66 per dozen.
Flock Size
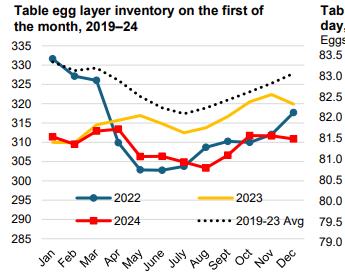
It is questioned whether hens among complexes and farms depopulated during January to date, have been accounted for. Depletion of large complexes in Missouri and Ohio have occurred this past week. Accurate and updated data should be posted during the current winter outbreaks, given the importance of weekly flock numbers in pricing. Current values for the populations of the producing and total flocks are required by farmers, packers, breakers and buyers.
According to the USDA the number of producing hens reflecting January 29th 2024 (rounded to 0.1 million) was down 0.9 million to 295.1 million suggesting that the rate of routine flock depletion and losses from HPAI is higher than the replenishment of flocks through molting and transfer of started pullets. This is consistent with sequential weekly losses. The total U.S. flock includes about one million molted hens due to return to production Approximately 4.5 to 5.0 million pullets on average reach maturity each week, based on USDA monthly chick-hatch data for 20-weeks previously. The increase is offset by routine flock depletion but depopulation due to HPAI continues to reduce the number of producing hens. Many flocks have been replaced on a rotational basis and routine flock depletion is delayed subject to availability of housing and started pullets.
According to the USDA the total U.S. egg-flock on January 29th 2025 was 1.0 million lower to 300.5 million hens including a larger than normal proportion of second-cycle birds and started pullets. The difference between total and producing flocks was 5.4 million (rounded). Data for the past four weeks indicated that molted hens are resuming production. Given the trajectory in benchmark wholesale prices, producers are retaining as many hens as allowed by capacity. At present it is estimated that there are approximately 26 million fewer hens in the total flock that now includes incident cases of HPAI in the fall and winter wave that have emerged from October through to the present. The apparent difference is equivalent to about 8.0 percent of the pre-HPAI 2022 national flock of 326 million hens.
INVENTORY LEVELS
- Cold storage stock of frozen products in selected centers on January 27th 2024 was 2.315 million lbs. (1,052 metric tons), and 0.1 percent down from 2.317 million lbs. on January 1st 2025 and unchanged from last week. The monthly USDA Cold Storage Report below quantified an increase in the actual total stock level at the end of December 2024.
- The most recent monthly USDA Cold Storage Report released on January 24th 2024 documented a total stock of 18.5 million pounds (8,403 metric tons) of frozen egg products on December 31st This quantity was down 38.0 percent from the December 31st 2023 value of 29.8 million pounds. The December 31st 2024 frozen egg inventory was down 6.9 percent from the previous month ending November 30th 2024 attributed to presumably higher domestic demand, decreased supply or their combination.
- Compared to December 31st 2023, the inventory of whites was down 43.8 percent to 1.56 million lbs. on December 31st
- Compared to December 31st 2023 yolk inventory was down 60.5 percent to 378,000 lbs. on December 31st
- A total of 89.5 percent (16.55 million lbs.) of combined inventory comprised the categories of “Whole and Mixed” (44.9 percent) and “Unclassified” (44.6 percent). The lack of specificity in classification requires a more diligent approach to enumerating and reporting of inventory as it appears that the USDA has the makings of a giant omelet!
Shell Inventory
The USDA reported that the national stock of generic shell eggs effective January 28th 2024 was down 3.1 percent from the previous week, to 1,431,000 million cases. The total inventory of shell eggs in industry cold rooms combined with breaking stock is at a rounded level of 1.43 million cases, (1.48 million last week; Down 45,600 cases).
Four USDA Regions reported lower stock levels this past week. The six regions are listed in descending order of stock: -
- The Midwest Region was down 2.7 percent from the previous week to 410,400 cases
- The Southeast Region was up 1.8 percent to 266,400 cases
- The South Central Region was down 9.8 percent to 165,400 cases
- The Northeast Region was up 3.4 percent to 163,700 cases
- The Southwest Region was down 1.6 percent to 100,400 cases.
- The Northwest Region was down 5.2 percent to 39,200 cases
The total USDA six-area stock of commodity eggs comprised 1,431,000 cases (1,476,600 cases last week), down 3.1 percent, of which 80.1 percent were shell eggs (79.2 percent last week). The inventory of breaking stock was down 7.3 percent to 285,400 cases. Shell-egg inventory was down 2.0 percent attaining 1,145,600 cases. Differences in inventory among regions are a function of weekly shell-egg demand and inter-regional movement.
The average price for Midwest breaking stock was up 5.0 percent last week and checks were up 8.4 percent in price. The average price for breaking stock and checks combined was equivalent to 45.5 percent of the average value of Midwest Extra-large and Large shell eggs, (46.2 percent last week) consistent with the differential in prices for shell eggs (up 8.3 percent) compared to a rise of 5.7 percent for breaking stock and checks combined this past week. The differential of 45.6 percent can be compared to 80.0 percent in April 2022 reflecting the initial period of high demand for both shell eggs and products following losses due to HPAI at the onset of the epornitic. The substantial increase in price for checks and breaking stock demonstrates the respective demands for shell eggs and egg products confirming the interconnectivity of the packing and breaking segments of the egg industry under circumstances of extreme disturbances in either supply (lower due to HPAI in 2022 to 2024) or demand (higher during early COVID in 2020). The relative prices for breaking stock and checks are influenced by the actual demand for generic shell eggs and contract obligations with breakers.
On January 27th 2025 inventory of other than generic eggs amounting to 442,800 cases (down 0.8 percent from last week at 446,400 cases) among three categories (with the previous week in parentheses) comprised: -
- Specialty category, down a substantial 25.1 percent to 29,100 cases on promotion. (was down 19.6% to 38,800 cases)
- Certified Organic, down 5.1 percent to 65,400 cases. (was down 3.5% to 68,900 cases)
- Cage-Free category, up 2.7 percent to 348,300 cases. (was down 5.0% to 339,200 cases)
Sales of specialty eggs generally increase as conventional (commodity) eggs are priced successively higher, as at present. A small differential in price encourages affluent consumers to move upmarket to organic, enriched and cage-free categories. The reverse is unfortunately true with reduced margins when conventional shell eggs are priced close to or below the cost of production
Consumers purchase less-expensive brown cage-free product over organic eggs when there is a differential in price greater than about $1.20 per dozen under normal conditions of supply and demand. Similarly, consumers will traditionally purchase white-shelled generic eggs in preference to white or brown-shelled cage-free with a differential of over $1.20 per dozen.
The industry requires a study on all aspects that influence pricing including shell color, GM status and nutritional enrichment using conjoint analysis. Above all, agricultural economists should evaluate the impact of disruption in supply and demand arising from large-scale depopulation following the 2015 and the ongoing 2022-2025 HPAI epornitics including the late spring to early summer wave of outbreaks and resumed cases in fall through to the present.
RELATIVE PRICES OF SHELL-EGG CATEGORIES
USDA-AMS posted the following national shell egg prices as available, on January 24th 2025 for the preceding week in the Egg Markets Overview report representing dozen cartons with comparable prices in parentheses for the previous week: -
Advertised Retail Prices representing features as reported January 24th for the previous week of January 17th do not reflect actual prevailing national or regional values especially compared with small numbers of stores featuring eggs:-
Large, in cartons generic white: None No comparison ($2.24)
Large, in cartons cage-free brown: $2.50 Down 5.3% ($2.64)
Wholesale
Midwest in cartons $6.49 Up 7.1% ($6.06)
Large C-F, California in Cartons: $8.97 Unchanged ($8.97)
National loose, (FOB dock): $6.55 Up 11.4% ($5.88)
NYC in cartons to retailer: $7.24 Up 7.7% ($6.72)
Regional in cartons to warehouse reported on January 24thfor the previous week.
Midwest $6.48 Up 62.0% ($4.00)
Northeast $6.56 Up 62.3% ($4.04)
Southeast $6.62 Up 60.3% ($4.13)
South Central $4.66 Up 60.1% ($4.16)
Combined $6.57 Up 61.0% ($4.08)
USDA CAGE-FREE DATA
According to the latest monthly USDA Cage-free Hen Report released on January 2nd 2025, the number of certified organic hens in December was unchanged from November 2024 at 20.3 million, (rounded to 0.1 million) representing the differential between replacements and scheduled flock depletions combined, offset by December flock depopulation due to HPAI.
The USDA reported that the cage-free (non-organic) flock in December 2024 was down 5.6 million hens (5.3 percent) from November 2024 to 100.0 million, (rounded to 0.1 million).
According to the USDA the population of hens producing cage-free and certified organic eggs in December 2024 comprised: -
Total U.S. flock held for USDA Certified Organic production = 20.3 million (20.0 million in Q3 2024).
Total U.S. flock held for cage-free production = 100.0 million (103.9 million in Q3 2024).
Total U.S. non-caged flock = 120.3 million (123.9 million in Q3 2024).
This total flock size represents 36.9 percent of a nominal 326 million total U.S. flock pre-HPAI in 2022 but 39.9 percent of the national flock after HPAI mortality to a presumed complement of 301.5 million in production. Hens certified under the USDA Organic program have decreased in proportion to cage-free flocks since Q1 of 2021.
Processed Eggs
For the processing week ending January 25th 2025 the quantity of eggs processed under FSIS inspection during the week as reported on January 29th 2024 was down 0.4 percent compared to the previous processing week to a level of 1,317,144 cases, (1,321,941 cases last week). The proportion of eggs broken by in-line complexes was 53.1 percent (52.7 percent processed in-line for the previous week) confirming a slightly higher proportion of in-line eggs processed. Diversion to higher-priced shell markets continues by uncommitted producers. The differential in price for shell sales and breaking will determine the movement of uncommitted eggs. This past week 71.9 percent of egg production was directed to the shell market, (71.8 percent for the previous week), responding to the differential in prices paid by breakers and packers. Breaking stock and checks were higher this past week suggesting moderately increased seasonal demand for liquids. Breaking stock inventory was down 7.3 percent this past week to 285,400 cases. Apparent demand from QSRs and casual dining is at stable to slightly lower levels. There is ongoing demand from baking and eat-at-home despite the weekly fluctuation in the inventory of breaking stock. During the corresponding processing week in 2024 in-line breakers processed 51.1 percent of eggs broken. With depletion of a large complex in Iowa dedicated to a major liquid processor it is anticipated that higher prices for breaking stock will prevail over the next few weeks and could escalate as in 2022 but with limited prospect of importation.
For the most recent monthly report reflecting December 2024, yield from 5,386,714 cases (7,66,144 cases in November) denoted an increase in demand for liquid and more diversion to shell egg sales over the period December 1st through December 28th 2024. Edible yield was 39.6 percent, distributed in the following proportions expressed as percentages: liquid whole, 63.2; white, 22.1; yolk, 11.2; dried, 3.4.
All eggs broken during 2024 attained 72.88 million cases, 4.8 percent less than in 2023. Eggs broken in 2025 to date amounted to 5.21 million cases, 8.6 percent less than the corresponding period in 2024. Weekly changes are attributed to fluctuations in demand for egg liquids from retail, food service and QSRs and casual dining restaurants. Consumers are constrained by economic uncertainty with high credit card interest rates, mortgage repayments or rent and a tendency to purchase only essentials.
PRODUCTION AND PRICES
Breaking Stock
The average rounded price for breaking stock was up 5.0 percent this past week to $3.18 per dozen with a most frequent range of $3.00 to $3.35 per dozen delivered to Central States plants on January 27th. The price of checks was up 8.4 percent to an average of $3.22 per dozen over the most frequent range of $3.21 to $3.23 per dozen. The market for breaking stock this week diverged from shell egg prices in both timing and value and is expected to increase as a result of flock depletions.
Shell Eggs
The USDA Egg Market News Report dated January 27th confirmed that Midwest wholesale prices for Extra-large and Large were up 8.3 percent from last week and Medium size was up 30.8 percent from the previous week. A 2.0 percent lower shell egg inventory, with a higher benchmark price, suggests that the market is operating with increased consumer demand and presumably with proportional orders from retail. The following table lists the “most frequent” ranges of values as delivered to warehouses:-
|
Size/Type
|
Current Week
|
Previous Week
|
|
Extra Large
|
702-705 cents per dozen
|
648-651 up 8.3%
|
|
Large
|
700-703 cents per dozen
|
646-649 up 8.3%
|
|
Medium
|
571-574 cents per dozen
|
436-439 up 30.8%
|
|
Processing:-
|
|
|
|
Breaking stock
|
300-335 cents per dozen
|
300-305 up 5.0%
|
|
Checks
|
321-323 cents per dozen
|
296-298 up 8.4%
|
The 2024 Midwest Regional (IA, WI, MN.) average FOB producer price on January 27th, for nest-run, grade-quality white shelled Large size eggs, with prices in rounded cents per dozen was up 8.6 percent from last week, (with the previous week in parentheses): -
- $7.06 ($6.50), (estimated by proportion): L. $7.04 ($6.48): M. $5.73 ($4.38)
The 2024 California negotiated price per dozen for cage-free, certified Proposition #12 compliant Large size in cartons delivered to a DC, on January 27th (with the previous week in parentheses) was unchanged from last week. The high price is attributed to depletion of flocks due to HPAI. In January 2024 the USDA documented a hen population of 9.1 million declining to 7.8 million in July and 4.4 million at the end of December 2024. The market is supplied with higher priced cage-free Midwest and Southwest states.
- $8.99 ($8.99); L. $8.97 ($8.97); M. $7.60 ($7.60)
Shell-Egg Demand Indicator
The USDA-AMS Shell Egg Demand Indicator reported on January 29th 2025 was up 1.7 points from the last weekly report to +5.5 with a 3.1 percent decrease in total inventory and a 2.0 percent lower shell inventory from the past week as determined by the USDA-ERS as follows: -
|
Productive flock
|
295,114,853 million hens (down 0.3%)
|
|
Average hen week production
|
81.6%(was 81.7%)
|
|
Average egg production
|
240,825,448 per day (down 0.4%)
|
|
Proportion to shell egg market
|
71.9% (was 71.8%)
|
|
Total for in-shell consumption
|
480,796 cases per day (down 0.4%)
|
|
USDA Table-egg inventory
|
1,145,600 cases (down 2.0%)
|
|
26-week rolling average inventory
|
4.05 days
|
|
Actual inventory on hand
|
3.84 days
|
|
Shell Egg Demand Indicator
|
+5.5 points(+3.8 point on January 23rd 2025)
|
COMMENTS
USDA reported the depopulation of 3.9 million laying hens as a result of HPAI this past week. Cases of HPAI were confirmed among backyard and non-WOAH flocks in five states (CT, MA, VT, IL and OR) confirming dissemination by waterfowl undergoing their southward migration along the Pacific, Central, Mississippi and Atlantic Flyways. The frequency of reports in non-commercial premises is a reflection of surveillance intensity. Cases emerged among broiler breeders and growing birds respectively in AR, GA, MO and VA, amounting to 0.2 million this past week. Losses among breeder and growing turkeys in MN, OH, MO and IN amounted to 0.5 million this past week. Given the prevailing risks and consequences of infection it will be necessary to intensify structural and operational biosecurity in poultry operations with anticipated exposure influenced by weather patterns and temperature in all four flyways. Incident outbreaks might be anticipated from domestic resident birds and spillover from dairy operations coincident with southward migration that is underway. Canada has experienced outbreaks in British Columbia, Alberta, Saskatchewan and more recently in Ontario and Quebec.
Approximate losses reported in 2024 include:-
- 40 million egg-producing hens and at least 3 million replacement pullets
- 4 million commercial meat turkeys with breeders
- 0 million broilers with breeders
- 400,000+ commercial and breeder ducks
- 400,000+ backyard and non-WOAH semi-commercial flocks and some game-birds
Backyard flocks allowed outside access will continue to be at risk of infection in the U.S. These small clusters of birds in both suburban and rural areas are of minimal significance to the epidemiology of avian influenza as it relates to the commercial industry. Backyard flocks serve as indicators of the presence of virus among free-living birds as evidenced by ongoing outbreaks in commercial poultry flocks across the U.S. Recent outbreaks in backyard flocks suggest shedding by resident, non-migratory free-living birds that may have become reservoirs. This has implications for seasonality and endemnicity.
|
Egg Projection January
|
01/23/2025 |
|
 Updated January 2025 USDA Projection for U.S. Egg Production and Consumption. Updated January 2025 USDA Projection for U.S. Egg Production and Consumption.
On January16th 2025 the USDA Economic Research Service (ERS) issued actual values for egg production during 2023 with an updated projection for 2024 and a forecast for 2025. Production, consumption and prices were revised from the previous December 16th 2024 report.
Projected egg production for 2024 was adjusted downward by 0.3 percent from the December 2024 Report to 7,728 million dozen This will be 1.7 percent less than in 2023 due to progressive depletion of hen flocks as a result of HPAI through December with incident cases occurring during January 2025. The per capita consumption of shell eggs and liquids combined for 2024 will be 272.9 eggs down 6.4 eggs (-2.3 percent) from 2023. The projected average 2024 benchmark New York bulk unit price was raised 121 cents to 303 cents per dozen above 2023.
Subsequent USDA projections will provide greater clarity on the recovery in consumption in an economy that is undergoing deflation in all food categories with the outstanding exception of eggs. The 2023 Midwest in-carton national wholesale price peaked at $5.17 per dozen on January 3rd 2023 but fell precipitously to a market bottom of $0.78 per dozen on May 8th 2023. Midwest Large wholesale price was restored during May 2024 and despite substantial declines during late August through September, attained $6.06 per dozen for Midwest Large, in cartons, delivered to DCs on January 17th 2024. The Midwest wholesale Large value should be compared to the USDA/EIC projection of the combined nest-run December 2024 value of 74.4 cents per dozen for caged white Large, plus a provision for processing, packaging and transport of 60 cents per dozen amounting to $1.34 cents per dozen (rounded).
 Restoration in flock size after HPAI depletions in 2022 progressed at a net rate of approximately 0.5 million per week. Placements were limited by the availability of pullet chicks and among some producers by the rate of conversion to alternative housing systems. Restoration of the national flock was compromised by a resurgence of HPAI with 40.0 million layers depleted during 2024 but with replacement averaging 24 million pullets per month. On January1st the total egg-producing flock was estimated by USDA1 to be 304 million hens, 22 million or 6.8 percent below the nominal producing flock of 326 million hens before the onset of the ongoing 2022 HPAI epornitic. Unpredictable factors affecting price will include consumer demand influenced by high shelf prices and the extent of anticipated losses during the late fall through early winter migratory season anticipated to end within weeks. Resumption of losses is anticipated in late spring months. Restoration in flock size after HPAI depletions in 2022 progressed at a net rate of approximately 0.5 million per week. Placements were limited by the availability of pullet chicks and among some producers by the rate of conversion to alternative housing systems. Restoration of the national flock was compromised by a resurgence of HPAI with 40.0 million layers depleted during 2024 but with replacement averaging 24 million pullets per month. On January1st the total egg-producing flock was estimated by USDA1 to be 304 million hens, 22 million or 6.8 percent below the nominal producing flock of 326 million hens before the onset of the ongoing 2022 HPAI epornitic. Unpredictable factors affecting price will include consumer demand influenced by high shelf prices and the extent of anticipated losses during the late fall through early winter migratory season anticipated to end within weeks. Resumption of losses is anticipated in late spring months.
Exports of eggs and products at approximately 2.2 percent of total production over the first eleven months of 2024 did not materially affect the domestic price. Future export volume will be constrained by high domestic prices.
The USDA forecast for 2025 includes production of 7,820 million dozen, up an optimistic 1.2 percent from 2024. Projected consumption of 276 eggs per capita, would be a more realistic 3 eggs or 1.1 percent compared to the December projection of a 2.9 percent (8 egg) increase over 2024, as documented in the December USDA report. This forecast probably presumes substantial control of HPAI and an adequate supply of replacement chicks and pullets, both unrealistic assumptions. The increase, if it were to transpire would depress the NY Large benchmark price to an average of $2.94 per dozen compared to the 2024 value.
During 2023 shell egg exports attained 89.4 million dozen, up 28.6 percent compared to 2022 when high domestic prices prevailed. Egg products were up 18.2 percent to 20,814 metric tons compared to 2022.
According to USDA data over the first eleven months of 2024, 75.2 million dozen shell-eggs were exported valued at $176 million. Volume was 7.8 percent lower but value was 19.0 percent higher compared to the corresponding months in 2023. Unit value was $2.34 per dozen, up 29.2 from the equivalent months in 2023.
Over the first eleven months of 2024, 23,947 metric tons of egg products were exported valued at $106 million. Volume and value were respectively 15.0 and 12.3 percent lower compared with the corresponding months in 2023. Unit value was 31.9 percent higher to $4,619 per metric ton on average for all product forms.
Updated January 2024 USDA data2 is shown in the table below:-
|
Parameter
|
2021
(actual)
|
2022*
(actual)
|
2023
(actual)
|
2024*
(projection)
|
2025
(forecast)
|
% Difference
2024-2025
|
|
|
|
|
|
|
|
|
|
Production (million dozen)
|
8,031
|
7,825
|
7,864
|
7,728
|
7,820
|
+1.2
|
|
Consumption (eggs per capita)
|
282.5
|
280.5
|
279.3
|
272.9
|
275.9
|
+1.1
|
|
New York price (c/doz.)
|
119
|
282
|
192
|
303.0
|
294.0
|
-3.0
|
*Data influenced by HPAI losses. Recovery over entire 2025 considered unrealistic
Sources: 1. USDA Chickens and Eggs released January 21st 2025
2. Livestock, Dairy and Poultry Outlook released January 16th 2025
|
Egg Month
|
01/14/2025 |
|
REVIEW OF DECEMBER 2024 EGG PRODUCTION COSTS AND STATISTICS.
This update of U.S egg-production statistics, costs and prices is sponsored by Big Dutchman USA for the information of stakeholders
DECEMBER HIGHLIGHTS
- December 2024 USDA ex-farm blended USDA nest-run, benchmark price for conventional eggs from caged hens was 424 cents per dozen, up 60 cents per dozen or 16.4 percent from the November 2024 value of 364 cents per dozen. The corresponding December 2022 and 2023 values were respectively $4.37 and $1.56 cents per dozen. For annual comparison, average monthly USDA benchmark price over 2023 was 146.0 cents per dozen compared to 247 cents per dozen for 2024. Stock levels and prices prior to the onset of flock depletions due to HPAI indicated a relative seasonal balance between supply and demand. Future nest-run and wholesale prices will be largely dependent on consumer demand for shell eggs and products and the rate of replacement of pullets and hens depleted due to HPAI. Other considerations include diversion to shell sales from the egg-breaking sector in an interconnected industry.
- Fluctuation in wholesale price is attributed in part to the amplification of upward and downward swings associated with the commercial benchmark price discovery system in use. Highly pathogenic avian influenza has emerged as a major driver with seasonal migration of waterfowl. Approximately 40 million hens and at least 2.0 million pullets were depleted in 2024 with close to 4 million during January to date.
- December 2024 USDA average nest-run production cost for conventional eggs from caged flocks over four regions (excluding SW and West), applying updated inputs was almost unchanged from November at 74.4 cents per dozen. The December average nest run production cost for other than caged hens was estimated by the EIC to be 93.4 cents per dozen. Approximately 60 cents per dozen should be added to the USDA benchmark nest-run costs to cover processing, packing material and transport to establish a realistic price as delivered to warehouses.
- December 2024 USDA benchmark nest-run margin for conventional eggs attained a positive value of 349.6 cents per dozen compared to a positive margin of 290.0 cents per dozen in November 2024. Average nest-run monthly margin over 2023 was 64.2 cents per dozen compared to 155 cents per dozen in 2022.
- December 2024 USDA benchmark nest-run margin for cage-free eggs attained a positive value of 673 cents per dozen compared to a positive margin of 361 cents per dozen in November 2024. Average nest-run monthly margin over 2024 was 440 cents per dozen compared with 100 cents per dozen in 2023.
- The November 2024 national flock (over 30,000 hens per farm) was stated by the USDA to be down 0.4 million hens (rounded and a probable over-count) to 311.3 million compared to the revised October 2024 value of 311.7 million. Approximately 3.0 million hens returned to production from molt in November together with projected maturation of 21.5 million pullets, with this number offset by depletion of an unknown number of spent hens.
- November 2024 pullet chick hatch of 24.4 million was down 11.3 percent or 3.1 million chicks from October 2024.
- November 2024 exports of shell eggs and products combined were down 19.6 percent from October 2024 to 325,000 case equivalents representing the theoretical production of 4.3 million hens. Canada and the Caribbean nations represented 95 percent of shell egg exports of 181,000 dozen. Japan, Canada and Mexico represented 72 percent of exports of egg products amounting to 144,000 case equivalents. Volumes shipped are based on the needs of importers, competition, availability in the U.S. and FOB price offered.
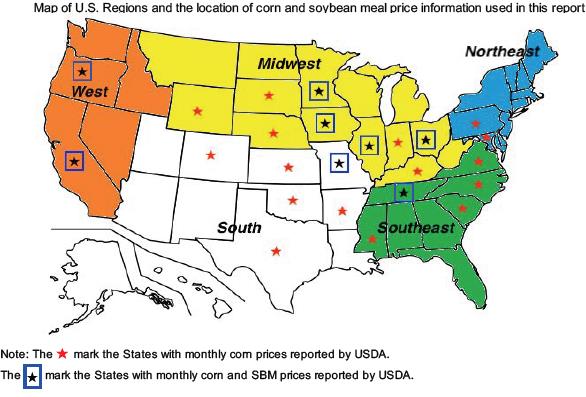 |
TABLES SHOWING KEY PARAMETERS FOR DECEMBER 2024.
Summary tables for the latest USDA December 2024 flock statistics, costs and unit prices made available by the EIC on January 9th 2025 are arranged, summarized, tabulated and compared with values from the previous December 9th 2024 release reflecting November 2024 costs and production data as applicable. Monthly comparisons of production data and costs are based on revised USDA values.
VOLUMES OF PRODUCTION REFLECTING THE ENTIRE INDUSTRY
|
PARAMETER
|
NOVEMBER 2024
|
DECEMBER 2024
|
|
Table-strain eggs in incubators
|
49.3 million (Nov.)
|
50.1 million (Dec.)
|
|
Pullet chicks hatched
|
27.5 million (Oct.)
|
24.4 million (Nov.)
|
|
Pullets to be housed 5 months after hatch
|
24.6* million (Mar.)
|
21.8 million (Apr.)
|
|
EIC 2023 December 1st U.S. total flock projection
|
310.9*million (Dec.)
|
311.7 million (Actual)
|
|
National Flock in farms over 30,000
|
296.4 million (Oct.)
|
295.6 million (Nov.)
|
|
National egg-producing flock
|
311.7 million (Oct.)
|
311.3 million (Nov.)
|
|
Cage-free flock excluding organic
Cage-free organic flock
|
105.6 million (Nov.)
20.3 million (Nov.)
|
100.0 million (Dec.)
20.3 million (Dec.)
|
|
Proportion of flocks in molt or post-molt
|
12.6%* (Nov.)
|
12.4% (Dec.)
|
|
Total of hens in National flock, 1st cycle (estimate)
|
272.4 million* (Oct.)
|
272.7 million (Nov.)
|
*USDA Revised
|
Total U.S. Eggs produced (billion)
|
7.91* November 2024
|
7.68 December 2024
|
|
Total Cage-Free hens in production
Proportion of organic population
|
125.9 million (Nov.)
16.8%* Organic
|
120.3 million (Dec.)
16.9% Organic
|
|
“Top-5” States hen population (USDA)1
|
153.7* million (Oct.)
|
153.8 million (Sept.)
|
- Revised USDA/EIC Note 1. Texas excluded to maintain confidentiality
PROPORTION OF U.S. TOTAL HENS BY STATE, 20241
Based on a nominal denominator of 290 million hens in flocks over 30,000 covering 95 percent of the U.S complement.
USDA has amended inclusion of specific states in regions and eliminated Texas data to protect confidentiality of Company flock
Sizes
|
STATE
|
OCTOBER1
2024
|
NOVEMBER
2024
|
|
Iowa
|
14.4%
|
14.9%
|
|
Indiana
|
12.2%
|
12.4%
|
|
Ohio
|
14.4%
|
14.2%
|
|
Pennsylvania
|
8.0%
|
8.1%
|
|
Texas (estimate)
|
7.0% ?
|
7.0%?
|
|
California
|
2.7%
|
2.3%
|
- Values rounded to 0.1%
Rate of Lay, weighted hen-week (USDA) 81.8% November 2024. 82.2% December 2024
*Revised USDA
|
Revised per capita
|
Egg consumption 2020
|
285.6 (down 7.8 eggs from 2019)
|
|
Revised per capita
|
Egg consumption 2021
|
282.5 (down 3.1 eggs from 2020)
|
|
Actual per capita
|
Egg consumption 2022
|
280.5 (down 2.0 eggs from 2021 due to HPAI)
|
|
Actual per capita
|
Egg consumption 2023
|
279.3 (down 1.2 eggs from 2022)
|
|
Projected per capita
Forecast per capita
|
Egg consumption 2024
Egg consumption 2025
|
273.5 ( down 5.8 eggs from 2023) attributed to HPAI losses)*
281.7 (up 8.2 eggs from 2024) forecast regarded as aspirational
|
*Revised, using data from USDA Livestock, Dairy and Poultry Outlook December 16th 2024 taking into account demand from the food service sector and presumably including the effect of HPAI depopulation.
EGG INVENTORIES AT BEGINNING OF DECEMBER 2024:
|
Shell Eggs
|
1.59 million cases down 3.5 percent from November 2024
|
|
Frozen Egg
Products
|
611,613 case equivalents, down 4.0 percent from November 2024
|
|
Dried Egg
Products
|
Not disclosed since March 2020 following market disruption due
To COVID. Moderate levels of inventory are assumed.
|
EGGS BROKEN UNDER FSIS INSPECTION (MILLION CASES) October 2024, 6.91* November 2024, 6.57
|
Cumulative eggs broken under FSIS inspection 2023 (million cases)
|
78.7
|
JAN. TO DEC.
|
|
Cumulative 2023: number of cases produced (million)
|
262.9
|
JAN. TO DEC.
|
|
Cumulative 2023: proportion of total eggs broken
|
29.9%
|
(30.8% 2022)
|
| |
|
|
|
Cumulative eggs broken under FSIS inspection 2024 (million cases)
|
73.2
|
JAN.-NOV.
|
|
Cumulative 2024: number of cases produced (million)
|
236.6
|
JAN.-NOV.
|
|
Cumulative 2024: proportion of total eggs broken
|
30.9%
|
JAN.-NOV.
|
EXPORTS NOVEMBER 2024: (Expressed as shell-equivalent cases of 360 eggs).
|
Parameter
|
Quantity Exported
|
|
Exports:
|
2024
|
|
Shell Eggs (thousand cases)
|
OCT. 223 NOV. 181
|
|
Products (thousand case equivalents)
|
OCT. 181 NOV. 144
|
|
TOTAL (thousand case equivalents)*
|
OCT. 404 NOV. 325
|
*Representing 1.5 percent of National production in November 2024 (1.9 percent in October 2024).
COSTS AND UNIT REVENUE VALUES1 FOR CONVENTIONAL EGGS FROM CAGED HENS
|
Parameter
|
NOVEMBER 2024
|
DECEMBER 2024
|
|
5-Region Cost of Production ex farm (1st Cycle)
|
74.0 c/doz
|
74.4 c/doz*
|
|
Low
|
72.0c/doz (MW)
|
72.4 c/doz (MW)
|
|
High
|
75.6 c/doz (NE)
|
76.0 c/doz (NE)
|
Notes: 1. Excludes SW and West *USDA revised
Components of Production cost per dozen:-
| |
NOVEMBER 2024
|
DECEMBER 2024
|
|
Feed
|
34.4 c/doz
|
34.7c/doz
|
|
Pullet depreciation
|
11.7 c/doz
|
11.7c/doz
|
|
Labor (estimate) plus
|
|
|
|
Housing (estimate) plus
|
27.9c/doz
|
28.0c/doz
|
|
Miscellaneous and other (adjusted May 2023)
|
|
|
Ex Farm Margin (rounded to nearest cent) according to USDA values reflecting DECEMBER 2024:-
424.0 cents per dozen1- 74.4 cents per dozen =349.6 cents per dozen (November 2024 comparison: 364.0 cents per dozen – 74.0 cents per dozen = 290.0 cents per dozen.
Note 1: USDA Blended nest-run egg price
| |
|
NOVEMBER 2024
|
DECEMBER 2024
|
|
USDA
|
Ex-farm Price (Large, White)
|
364.0 c/doz (Nov.)
|
424.0c/doz (Dec.)
|
| |
Warehouse/Dist. Center
|
425.3 c/doz (Nov.)
|
450.8c/doz (Dec.)
|
| |
Store delivered (estimate)
|
430.3 c/doz (Nov.)
|
455.8 c/doz (Dec.)
|
| |
Dept. Commerce Retail National
|
337.0 c/doz (Oct.)
|
365.0 c/doz (Dec.)
|
| |
Dept. Commerce Retail Midwest
|
317.0 c/doz (Oct.)
|
394.0 c/doz (Nov.)
|
| |
NOVEMBER 2024
|
DECEMBER 2024
|
|
U.S. Av Feed Cost per ton
|
$220.86
|
$220.92
|
|
Low Cost – Midwest
|
$198.88
|
$200.88
|
|
High Cost – West
|
$264.35
|
$256.85
|
|
Differential
|
$ 65.47
|
$ 55.96
|
|
Pullet Cost 19 Weeks
|
$4.55 November 2024
|
$4.56 December 2024
|
|
Pullet Cost 16 Weeks
|
$4.00 November 2024
|
$4.02 December 2024
|
COSTS AND UNIT REVENUE FOR EGGS FROM CAGE-FREE HENS
|
Parameter
|
NOVEMBER 2024
|
DECEMBER 2024
|
|
5-Region Cost of Production ex farm (1st Cycle)
|
93.4 c/doz
|
93.4 c/doz
|
|
Low
|
89.0c/doz* (MW)
|
89.4 c/doz (MW)
|
|
High
|
102.1 c/doz (West)
|
102.0 c/doz (West)
|
* USDA Revised
Components of Production cost for cage-free eggs, per dozen:-
| |
NOVEMBER 2024
|
DECEMBER2024
|
|
Feed
|
40.1 c/doz
|
40.1 c/doz
|
|
Pullet depreciation
|
15.5 c/doz
|
15.5 c/doz
|
|
Labor (estimate) plus
|
|
|
|
Housing (estimate) plus
|
37.8c/doz
|
37.8 c/doz
|
|
Miscellaneous and other
|
|
|
Ex Farm Margin (rounded to nearest cent) according to USDA values reflecting negotiated price for DECEMBER 2024:-
Cage-Free brown 766.0 cents per dozen1- 93.4 cents per dozen = 672.6 cents per dozen
November 2024 455.0 cents per dozen - 93.4 cents per dozen = 361.6 cents per dozen
| |
|
NOVEMBER 2024
|
DECEMBER 2024
|
|
USDA
|
Average Ex-farm Price1
|
170 c/doz (Nov.)
|
170 c/doz (Dec.)
|
| |
Warehouse/Dist. Center2
|
455 c/doz (Nov.)
|
766 c/doz (Dec.)
|
| |
Store delivered (estimate)
|
460 c/doz (Nov.)
|
772 c/doz (Dec.)
|
| |
Dept. Com. Retail3 C-F Brown
Dept. Com. Retail3 C-F White
|
290 c/doz (Nov.)
323 c/doz (Nov.)
|
290 c/doz (Dec.)
355 c/doz (Dec.)
|
| |
Dept. Com. Retail Organic
Dept. Com. Retail Pasture
|
610 c/doz (Nov.)
644 c/doz (Nov.)
|
536 c/doz (Dec.)
644 c/doz (Dec.)
|
Contract price, nest-run loose Range 135 to 235 c/doz. unchanged since July and unrealistic.- Range $1.65 to $3.35 per dozen
- Unrealistic USDA prices!
|
Cage-Free* Pullet Cost 19 Weeks
|
$5.54 November 2024
|
$5.54 December 2024
|
|
Cage-Free* Pullet Cost 16 Weeks
|
$4.84 November 2024
|
$4.84 December 2024
|
* Conventional (non-organic) feed
Feed prices used are the average national and regional values for caged flocks. Excludes Organic feeds with prices substantially higher than conventional.
|
USDA Grain Stocks Report
|
09/30/2024 |
|
 The USDA quarterly Grain Stocks Report released on September 30th 2024, documented storage of corn and soybeans, classified according to on-site and remote facilities including elevators and commercial installations. Quantities of the two major ingredients as Prices and commentary are incorporated in the Weekly Energy, Economy and determined by USD-NASS, relevant to the cost of poultry production were:- The USDA quarterly Grain Stocks Report released on September 30th 2024, documented storage of corn and soybeans, classified according to on-site and remote facilities including elevators and commercial installations. Quantities of the two major ingredients as Prices and commentary are incorporated in the Weekly Energy, Economy and determined by USD-NASS, relevant to the cost of poultry production were:-
“Old crop corn stocks on hand as of September 1st 2024 totaled 1.76 billion bushels, up 29 percent from September 1st 2023. Of the total corn stocks, 780 million bushels (44 percent were stored on farms), up 29 percent from last year”. This was down from 61 percent three months ago indicating a sell-off despite declining prices to realize income and make room for the 2024 harvest. “Off-farm stocks, at 980 million bushels, were up 30 percent from a year ago. The June-August 2024 indicated disappearance was 3.24 billion bushels, compared with 2.74 billion bushels during the same period a year earlier”.
“Old crop soybeans stored in all positions on September 1st 2024 totaled 342 million bushels, up 29 percent from September 1st 2023. Soybean stocks stored on farms totaled 111 million bushels, (32 percent) up 54 percent from a year ago. Off-farm stocks, at 231 million bushels, were up 20 percent from last September. Indicated disappearance for June-August 2024 totaled 628 million bushels, up 18 percent from the same period a year earlier”.
The weekly Economy, Commodity and Energy Report posted each week and a summary of the WASDE #652 released on September 12th is retrievable under the STATISTICS tab.
|
USDA Agricultural Prices Report
|
11/17/2023 |
|
 THE USDA Agricultural Prices Report released October 31st posted September prices for agricultural commodities and expenditures. THE USDA Agricultural Prices Report released October 31st posted September prices for agricultural commodities and expenditures.
September Prices Received Index, down 2.9 percent from August
The USDA ERS summarized prices as follows:-“The September Prices Received Index 2011 Base (Agricultural Production), at 122.6, decreased 2.9 percent from August and 7.1 percent from September 2022. At 113.9, the Crop Production Index was down 4.2 percent from last month and 11 percent from the previous year. The Livestock Production Index, at 133.1, decreased 0.9 percent from August, and 2.6 percent from September last year. Producers received lower prices for corn, hogs, soybeans, and lettuce during September, but higher prices for broilers, milk, grapes, and broccoli. In addition to prices, the volume change of commodities marketed also influences the indexes. In September, there was decreased marketing of cattle, wheat, cotton, and peaches and increased monthly movement for soybeans, corn, dry beans, and apples”.
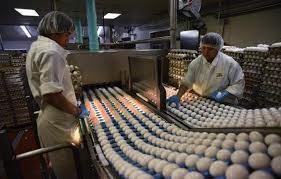
September Prices Paid Index, Up 0.1 Percent from August
“The September Prices Paid Index for Commodities and Services, Interest, Taxes, and Farm Wage Rates (PPITW), at 138.8, is up 0.1 percent from August 2023 but unchanged from September 2022. Higher prices in September for feeder cattle, feeder pigs, diesel, and nitrogen more than offset lower prices for feed grains, complete feeds, concentrates, and hay & forages”.
Corn farmers received $5.21 per bushel in September 2023 compared to $5.73 per bushel in August 2023, down 9.1 percent. The price received in September 2022 was $7.09 per bushel
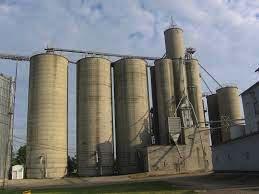
Soybean farmers received $13.20 per bushel in September 2023 compared to $14.10 per bushel in August 2023, down 6.8 percent. The price received in September 2022 was $14.20 per bushel
The September 2023 egg price received by farmers was $ 1.22 per dozen for table eggs lower than $1.35 per dozen in August 2023 and compared to $2.65 per dozen in September 2022. The sharp year-on-year increase is attributed to disequilibrium between supply and demand. Highly pathogenic avian influenza resulted in depletion of 44 million hens with a reduction of 20 million producing birds in the supply flock on average from mid 2022 onwards. This situation was coupled with increased demand as consumers increased purchases of eggs representing a competitively priced protein source in an inflationary environment.
|
Planted Acreage Report
|
06/30/2023 |
|
The June 30th 2023 Planted Acreage report documented the respective areas planted to corn and soybeans, the two commodities of relevance to the poultry industry. The USDA confirmed:-
Corn-planted area for all purposes in 2023 is estimated at 94.1 million acres, up six percent or 5.52 million acres from last year. This represents the third highest planted acreage in the United States since 1944. Compared with last year, planted acreage is expected to be up or unchanged in 43 of the 48 estimating States. Area harvested for grain, at 86.3 million acres, is up nine percent from last year.
Soybean-planted area for 2023 is estimated at 83.5 million acres, down five percent from last year. Compared with last year, planted acreage is down or unchanged in 21 of the 29 estimating States.
Together with the Grain Stocks report the Planted Acreage data moved the market for corn and soybeans by about five percent but in contrasting directions.
For corn the acreage was above the most optimistic projection although offset by a lower stock. At 14H30 on the CME after the release of the two USDA reports, corn was down 25 cents per bushel to 556 cents for July delivery and for September, corn was down 34 cents per bushel to 489 cents.
For soybeans the reduced acreage and consequently lower ending stocks was bullish for the new crop. At 14H30 CME soybeans were up 75 cents per bushel to 1,558 cents for July delivery and for September the soybean price was up 73 cents per bushel to 1,354 cents.
|
USDA-ERS Predicts Egg Prices for 2023
|
02/27/2023 |
|
 According to USDA economists, retail egg prices increased by 8.5 percent in January 2023, approximately 70.1 percent above January 2022. The USDA-ERS now predicts that egg prices will increase by 37.8 percent in 2023 but with a wide range of 18.3 to 62.3 percent attributed to volatility. Concurrently the USDA-ERS predicted a 4.7 percent increase in the p According to USDA economists, retail egg prices increased by 8.5 percent in January 2023, approximately 70.1 percent above January 2022. The USDA-ERS now predicts that egg prices will increase by 37.8 percent in 2023 but with a wide range of 18.3 to 62.3 percent attributed to volatility. Concurrently the USDA-ERS predicted a 4.7 percent increase in the p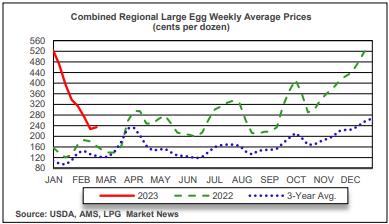 rice of meats, 7.2 percent for dairy products and 12.8 percent for cereals and bakery products. rice of meats, 7.2 percent for dairy products and 12.8 percent for cereals and bakery products.
Wholesale farm-level egg prices are predicted to increase by 7.4 percent in 2023 with a wide prediction interval of -32.6 to 76.1 percent. Egg prices are extremely volatile, complicating reliable predictions.
EGG-NEWS will monitor weekly USDA wholesale prices by region and average retail prices to document retail margins.
|
|
|
Top
|
|