
|
|
|
 |
 |
 |
|
EGG‑NEWS.com
Egg Industry News, Comments & More by
Simon M.Shane
|
|
 |
|
 |
|
 |
Egg Industry News
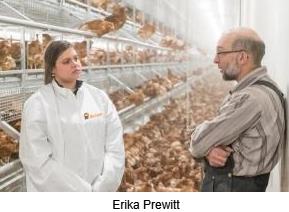
Interview with Erika Prewitt, Big-Dutchman Aviary Systems Specialist
|
03/18/2025 |
|
 EGG-NEWS: Please share some of your background and experience with our subscribers. EGG-NEWS: Please share some of your background and experience with our subscribers.
Erika Prewitt:
I was born and raised on a farm in central Indiana – mostly row crops and cattle. I earned a bachelor’s degree in agriculture from Eastern Kentucky University. My graduate studies were at Kansas State University, where I was awarded an MS in genetics and breeding. I served as a teacher at Southwestern Iowa College where I managed the university farm and was responsible for courses in agriculture and animal science
EGG-NEWS: When did you enter the poultry industry?
Erika Prewitt:
I was recruited by Big Dutchman in 2016 to serve in my current position.
Fortunately, I had the opportunity to be mentored by Bill Snow, an acknowledged expert in cage-free and aviary systems. He introduced me to practical aspects of rearing and egg production for aviary and barn housing. Working together with customers and applying my basic knowledge of animal science, I was able to apply both theoretical and practical information for the benefit of our customers.
EGG-NEWS: What is your contribution to Big Dutchman USA?
Erika Prewitt:
I am responsible for guidance, especially for new customers who have converted to aviary rearing and laying systems. I provide support through on-farm consultation and remote guidance as a free service to our customers. Our range extends from a typical 20,000-hen organic barn to a multi-level laying house with 300,000 birds incorporating sophisticated ventilation and lighting installations.
EGG-NEWS. What are the key areas of concentration in rearing pullets to perform to breed standard in laying aviaries?
Erika Prewitt:
I strongly believe that a good pullet is necessary for a successful laying cycle. Management and housing should be appropriate to each of the life stages of a pullet to achieve genetic potential. The design of our equipment is intended to support growth, musculoskeletal development, and flock uniformity.
Areas of concern include achieving a uniform temperature and even ventilation during brooding; ensuring that the flock returns to the aviary at night when they are released at about five weeks of age. Our lighting systems with dimmers create an artificial sundown that encourages return to the aviary with perching. The installation of ramps is necessary for young pullets to learn to move vertically between the tiers and to develop balance and agility.
EGG-NEWS: Producers appear to be concerned over the transition period from rearing to laying. Have you any observations?
Erika Prewitt:
It is absolutely essential that the rearing system be compatible with the laying aviary. This includes feeding and watering systems and ramps to allow even distribution of the flock among tiers after transfer. Ensuring that levels of light and noise are similar in both rearing and laying houses reduces stress and prevents excitement in the flock that is deleterious to subsequent production. “Walking” flocks regularly through both rearing and the post-transfer period habituate pullets to their environment and hens learn to accept the movement of workers resulting in a calm and productive flock.
EGG-NEWS: Any additional suggestions to achieve optimal production?
Erika Prewitt:
It is necessary to exercise good stockmanship, recognize deviations from normal behavior, maintain good records, and communicate with suppliers of equipment. Producers should make use of the resources of primary breeders, nutritionists, veterinarians, extension personnel of Land Grant schools, and poultry associations. The gap in production between cage and cage-free flocks has narrowed considerably over the past five years, attributed to better equipment and more knowledgeable managers responding to the needs of their flocks.
EGG-NEWS: Thank you, Erika.

|
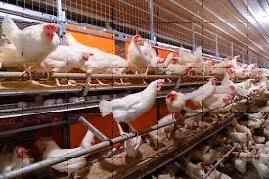
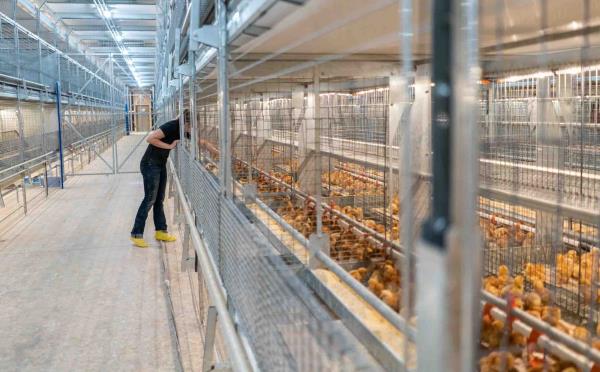
Big Dutchman NATURA® Filia Rearing System
|
03/13/2025 |
|
The performance of a laying flock is predicated on achieving uniform maturity, body weight, and reproductive development consistent with genetic potential. Eggs lost at the beginning of a cycle can never be made up. Attaining an early onset in production, a rapid increase in case weight, a high peak, and persistence are all dependent on the development of flocks from day old through rearing and post-transfer training.
Big Dutchman has acquired experience in the design and manufacture of rearing systems for cage-free production based on the physiological needs of pullets. The NATURA® Filia rearing system incorporates the recommendations of research institutes and producers to apply a range of operational procedures relating to feeding, vaccination, and handling that allow optimal musculoskeletal development and flock welfare.
Big Dutchman NATURA® Filia Rearing System
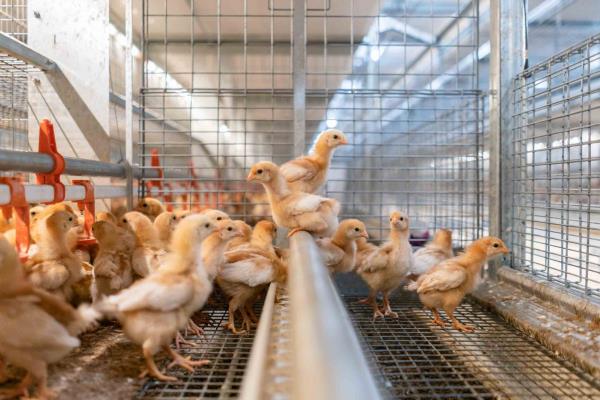
- Flocks are placed in the lower of the two tiers of the NATURA® Filia system for the brooding phase that extends to three weeks. This allows for optimal visibility, temperature control, and feed intake.
- At 3 to 4 weeks of age, consistent with the management schedule, flocks are vaccinated and are divided evenly between the two tiers.
- At 5 to 6 weeks, doors are opened, allowing pullets to access the aisles and to move between tiers using the ramps, bridges, and adjustable perches incorporated into the system. Both lateral and vertical movement in the NATURA® Filia installation is critical to developing balance and muscle development to allow flocks to adapt to compatible Big Dutchman NATURA® Step or Visio laying systems. Each of the components of the NATURA® Filia is based on a scientific evaluation of the needs of pullets and contributes to uniformity and maturity at the time of transfer, usually at 16 to 17 weeks of age. Features of the NATURA® Filia include:
Construction
The NATURA® Filia incorporates durable construction with floors fabricated from zinc-aluminum coated wire, resistant to corrosion. Support structures are designed and engineered for stability and are compatible with houses over 300 feet. Sliding doors are designed for ease of opening for chick placement and flock transfer.
Sliding doors facilitate chick placement, vaccination and transfer
|
Moveable partitions are installed at 5-foot intervals on both tiers to confine chicks to smaller groups during the brooding and early rearing phases. The partitions facilitate vaccination or other procedures requiring individual handling of birds. As the flock ages, partitions can be opened to create larger groups within the tier.
Interior view of lower tier during brooding showing moveable partition (rear) and perches above feeder trough and drinker line
|
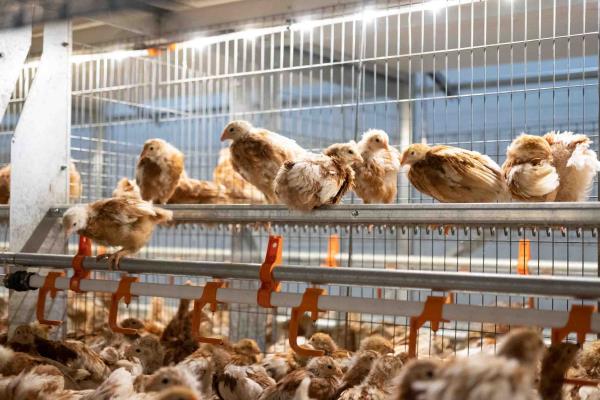
Flock Comfort and Development
The NATURA® Filia system incorporates bridges from the lower tier to the floor, ramps between the two tiers, and step platforms. Perches with a patented design are positioned to encourage the flock to face the aisle, allowing manure to be collected on belts. This reduces fecal accumulation along the aisles and reduces the production of ammonia in litter.
Feeders and Drinkers
Each tier is equipped with a proven Big Dutchman chain circuit designed to prevent spillage. Guards are installed in the feed trough during the brooding period.
Perches are installed above the drinker lines and feed circuits to limit soiling.
Drinker lines comprising nipples with drip cups can be raised consistently with the growth of the flock.
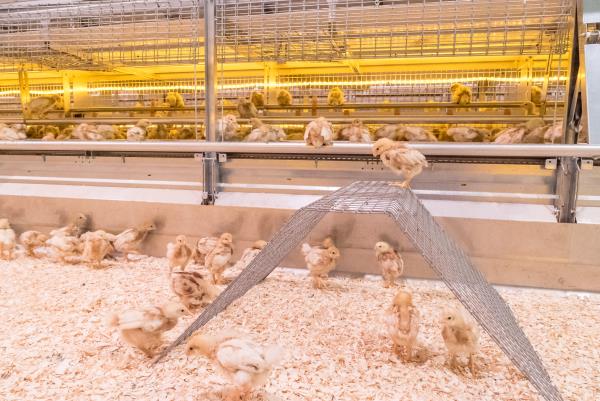
Bridges encourage chicks to descend to litter from brooding tier
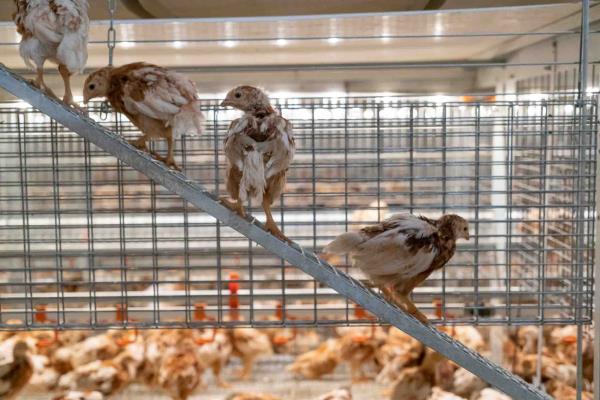
Ramps allow pullets to transit between tiers
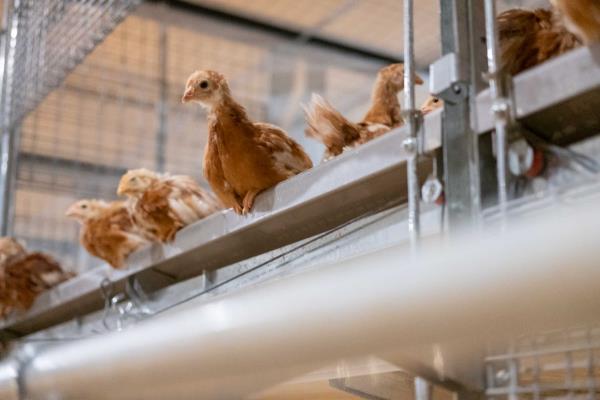
Patented perch design and placement orients pullets to face the aisle
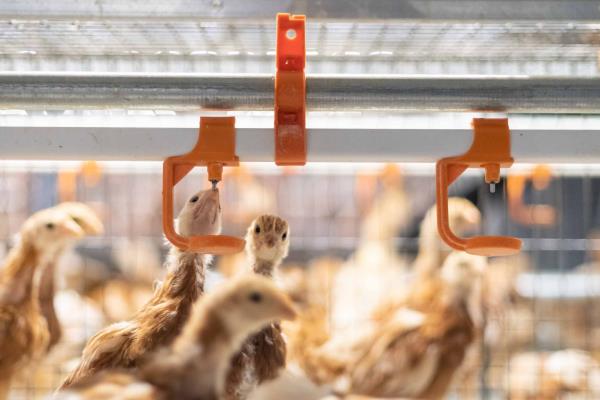
Nipple drinkers with drip cups are located on each tier
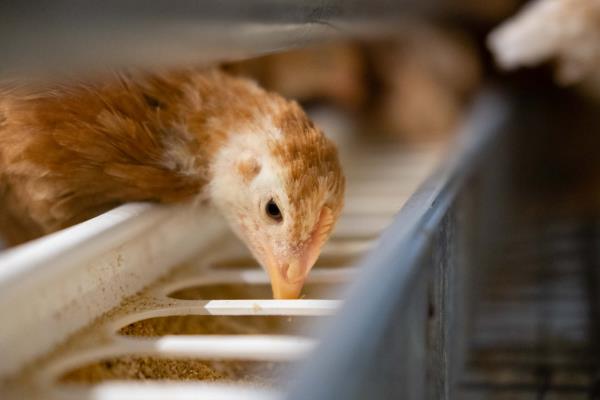
Feeder trough fitted with removable anti-waste insert during brooding
|
Lighting
A range of lighting installations is available including LED fixtures along the aisles and within the system. Compatibility in design between the NATURA® Filia rearing system and the Big Dutchman NATURA® Step and Visio laying installations ensures a harmonious transition after transfer. This reduces stress and excitability in the flock which is deleterious to subsequent production. The lighting system is dimmable and can provide an artificial sunset to encourage the flock to return to the perches during the dark periods.
Strip LED lighting in each tier, together with aisle installations are dimmable and can be configured for an artificial sunset
|
Ventilation
Big Dutchman provides compatible ventilation installations including fans, inlets, controllers, and alarms. The NATURA® Filia system is available with an optional air duct over the manure belt to reduce the moisture content of litter and hence production of ammonia.
Dimensions
NATURA® Filia systems are available in two widths to maximize capacity conforming to house dimensions, whether a new installation or a retrofit. The model 1800 has a width of 74 inches. The model 2200 is 88 inches in width. Both systems are 9 feet in height from the floor to the top of the second tier.
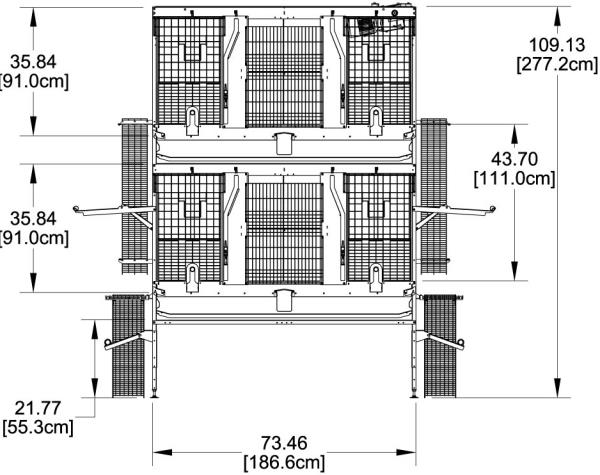
Dimensions of NATURA(R) Filia Model 1800
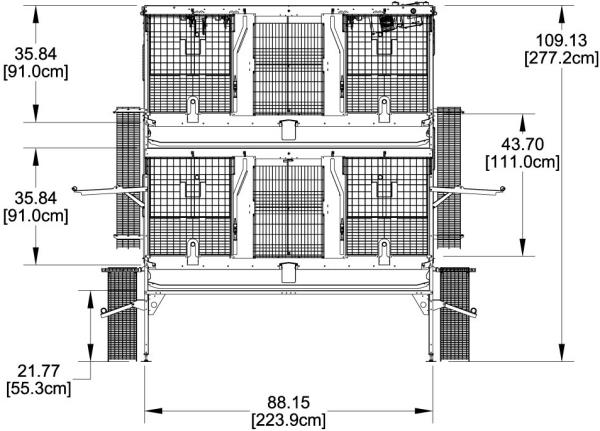
Dimensions of NATURA(R) Filia Model 2200.
|
Additional information on the NATURA® Filia system is available by clicking on the Big Dutchman logo at the top of this article. Design projections for either retrofits or new houses are available from regional sales representatives or an authorized Big Dutchman distributor.
|
Epidemiology of Highly Pathogenic Avian Influenza
|
03/10/2025 |
|
Epidemiologist affiliated with the Center for Disease Control and Prevention (CDC) and the California Department of Public Health have published on their investigations of 46 U.S. human cases of H5N1 influenza1. Cases occurred in six states from March through October 2024 and were associated with occupational exposure among workers involved in depopulation of infected flocks and contact with dairy cattle.
The mild clinical signs including conjunctivitis and respiratory signs were documented. Among the 20 poultry-related exposures and 25 dairy workers, there were no hospitalizations and no evidence of infection among 97 direct household contacts. Only 25 percent of the patients had received a seasonal influenza vaccination over the past 12 months. Among the poultry workers, 65 percent were provided with eye protection and a face mask or respirator, and PPE use was regarded as “suboptimal”.
Inoculation of ferrets with the A/Texas/37/2024A (H5N1) virus led to severe infection and mortality. In contrast the A/Michigan/90/2024A (H5N1) virus was less pathogenic in this laboratory animal. The Texas strain had two changes in polymerase proteins that facilitate replication in mammalian tissue culture.
The severe case of unknown origin affecting a teenager in Canada and the fatal case in an elderly patient in Louisiana were characterized as a D1.1 genotype associated with wild birds.
An accompanying editorial2 in the New England Journal of Medicine, stressed the following:-
• Collaboration is necessary among agencies and investigators in human and veterinary medicine, public health and occupational medicine.
• Mutations identified in the virus isolated from the case in Canada emphasize the need for surveillance of avian influenza viruses isolated from human to predict changes that may facilitate person-to-person transmission.
• Countermeasures including antiviral therapy and vaccines must be continually evaluated including susceptibility to single drugs or combination of antivirals.
• Prevention of occupational exposure is evident. Apart from providing masks, respirators and face shields, instruction and supervision in their correct use will reduce the probability of infection.
The editorial emphasized the need for balance between “enhanced vigilance and business as usual." Epidemiologic studies are necessary to acquire an understanding of the extent of exposure, viral evolution and transmission. Although the CDC has established that the risk of human infection is currently low the emergence of a contagious strain would potentially be catastrophic. This realization should be a major consideration in suppressing infection in herds and flocks that come into contact with infected birds and animals.
1. Garg, S. et al Highly Pathogenic Avian Influenza A (H5N1) Virus Infection in Humans. N. Engl. J. Med (2025) 392:843-854
2. Ison, M. and Marrazzo, J. The Emerging Threat of H5N1 to Human Health. N.Engl. J. Med (2025) 392:916-918
|
Tony Wesner Advocates for HPAI Vaccination
|
03/09/2025 |
|
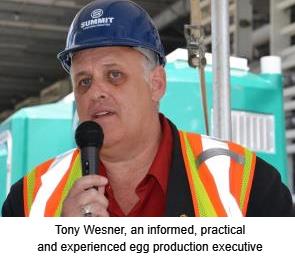 Appearing before the U.S. Senate Committee on Agriculture, Nutrition and Forestry on February 26th Tony Wesner representing Rose Acre Farms and the egg production segment of the industry advocated strongly for preventive vaccination against H5N1 avian influenza. Appearing before the U.S. Senate Committee on Agriculture, Nutrition and Forestry on February 26th Tony Wesner representing Rose Acre Farms and the egg production segment of the industry advocated strongly for preventive vaccination against H5N1 avian influenza.
 Acknowledging the potential restraints relating to export of broiler leg quarter, Wesner stated, “I can’t understand why we all cannot get together with those countries and figure this out, so we don’t ruin trade.” He added, “Vaccination is a serious consideration for HPAI not only for the egg industry but also the turkey and dairy industries which have been effected by the virus.” Acknowledging the potential restraints relating to export of broiler leg quarter, Wesner stated, “I can’t understand why we all cannot get together with those countries and figure this out, so we don’t ruin trade.” He added, “Vaccination is a serious consideration for HPAI not only for the egg industry but also the turkey and dairy industries which have been effected by the virus.”
Wesner noted that the loss of producing hens will be reflected in lower supplies and higher prices for some time to come, conflicting with the dministration initiative to reduce food inflation.
Wesner was supported in his advocacy for vaccination by the National Turkey Federation whose membership has been impacted by H5N1 avian influenza.
|
RFK Jr. Opposes HPAI Vaccination
|
03/09/2025 |
|
 In a recent interview on Fox News the Secretary of the Department of Health and Human Services, Robert F Kennedy Jr. expressed his opposition to deploying vaccine against HPAI. Citing the absence of proof of ‘sterilizing immunity’ in the event of vaccination, he claimed without scientific evidence and in defiance of logic, that immunized flocks could become ‘mutation factories’. In a recent interview on Fox News the Secretary of the Department of Health and Human Services, Robert F Kennedy Jr. expressed his opposition to deploying vaccine against HPAI. Citing the absence of proof of ‘sterilizing immunity’ in the event of vaccination, he claimed without scientific evidence and in defiance of logic, that immunized flocks could become ‘mutation factories’.
The antipathy of the Secretary towards vaccines is well established and his disdain of science and established epidemiology is a matter of record. Unfortunately he has an extensive following and currently exercises influence within the Administration by virtue of his position.
No vaccine can offer ‘sterilizing immunity’ but effective vaccines can raise the level of population immunity to above the disease threshold. We eliminated clinical poliomyelitis and measles decades ago but now risk of the return of these and other infections is evident through the sophistry of charlatans such as the Secretary and his acolytes.
Maintaining large populations of susceptible commercial laying hens that become infected from migratory waterfowl by the aerogenous route will lead to massive proliferation of H5 influenza virus thereby increasing the probability of mutations. Then inserting workers with incomplete PPE protection to depopulate flocks only adds to risk. Gene sequencing has demonstrated mutations in H5N1 in isolates from workers. The emergence of bovine influenza H5N1 type B3.13 and mass mortality in marine mammals confirming contagion, demonstrates the ability of the virus to undergo mutation. At the end of the day it’s a numbers game. By creating highly immunized flocks we will reduce the risk of emergence of zoonotic strains. Admittedly vaccination will result in some genetic drift as in all immunized human and livestock populations but this will be manageable and infinitely preferable to the current situation of ongoing flock depopulation with risk of mutations.
The Secretary is apparently oblivious to the low risk of an emerging zoonotic strain of H5N1 with contagion but is equally unconcerned over the catastrophic economic and human consequences of a pandemic. What will his response be? Mass administration of cod liver oil as ifor the expanding measles epidemic?
|
REVIEW OF FEBRUARY 2025 EGG PRODUCTION COSTS AND STATISTICS.
|
03/08/2025 |
|
This update of U.S egg-production statistics, costs and prices is sponsored by Big Dutchman USA for the information of producers and stakeholders
FEBRUARY HIGHLIGHTS
- February 2025 USDA ex-farm blended USDA nest-run, benchmark price for conventional eggs from caged hens was 740 cents per dozen, up 156 cents per dozen or 27.1 percent from the January 2025 value of 582 cents per dozen. The corresponding February 2023 and 2024 values were respectively $2.11 and $1.33 cents per dozen. For annual comparison, average monthly USDA benchmark price over 2023 was 146.0 cents per dozen compared to 247 cents per dozen for 2024. Stock levels and prices prior to the onset of flock depletions due to HPAI indicated a relative seasonal balance between supply and demand. Future nest-run and wholesale prices will be largely dependent on consumer demand for shell eggs and products and the rate of replacement of pullets and hens depleted due to HPAI. Other considerations include diversion to shell sales from the egg-breaking sector in an interconnected industry.
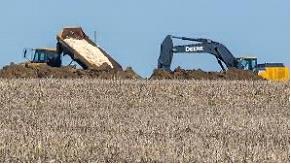
- Fluctuation in wholesale price is attributed in part to the amplification of upward and downward swings associated with the commercial benchmark price-discovery system in use. An additional factor influencing pricing is the proportion of shell eggs supplied under cost-plus contracts accentuating the upward and downward price trajectory of uncommitted eggs. Highly pathogenic avian influenza is currently the major driver of price with a high incidence rate. Approximately 40 million hens and at least 2.0 million pullets were depleted in 2024 with to 31 million birds in 31 complexes or farms year to date.
- February 2025 USDA average nest-run production cost for conventional eggs from caged flocks over four regions (excluding SW and West), applying updated inputs was unchanged from January 2025 at 76.1 cents per dozen. The February average nest run production cost for other than caged hens was estimated by the EIC to be unchanged at 95.3 cents per dozen. Approximately 60 cents per dozen should be added to the USDA benchmark nest-run costs to cover processing, packing material and transport to establish a realistic cost value as delivered to warehouses.
- February 2025 USDA benchmark nest-run margin for conventional eggs attained a positive value of 663.9 cents per dozen compared to a positive margin of 505.9 cents per dozen in January 2025. Average nest-run monthly margin for 2024 was 170.8 cents per dozen compared to 64.2 cents per dozen over 2023 and 155 cents in 2022.
- February 2025 USDA benchmark nest-run margin for all categories of cage-free eggs attained a positive value of 820.7 cents per dozen compared to a positive margin of 713.7 cents per dozen in January 2025. Average nest-run monthly margin over 2024 was 440 cents per dozen compared with 100 cents per dozen in 2023, relatively unaffected by HPAI compared to the preceding and following years.
- The January 2025 national flock (over 30,000 hens per farm) was stated by the USDA to be down 10.4 million hens (rounded and a probable over-count) to 297.8 million compared to the revised December 2024 value of 308.2 million and relative to 326 million before the advent of HPAI in 2022. Approximately 3.5 million hens returned to production from molt in December together with projected maturation of 26 million pullets, with this number offset by depletion of an unknown number of spent hens.
- January 2025 pullet chick hatch of 28.1 million was up 1.5 million (+5.6 percent) from December 2024 reflecting increased industry demand for replacements of depopulated flocks.
- January 2025 exports of shell eggs and products combined were down 15.9 percent from December 2024 to 369,000 case equivalents representing the theoretical production of 4.9 million hens. Shell egg exports totaling 239,000 cases were dominated by Canada (84 percent of volume) and the Caribbean nations (15 percent). With respect to 130,000 case equivalents of egg products, Japan, (31 percent of volume), Canada, (25 percent) and Mexico, (18 percent) collectively represented 81 percent of shipments. Volumes exported are based on the needs of importers, competition, availability in the U.S. and FOB prices offered.
(insert US map showing regions)
TABLES SHOWING KEY PARAMETERS FOR FEBRUARY 2025.
Summary tables for the latest USDA February 2025 flock statistics, costs and unit prices made available by the EIC on March 7th 2025 are arranged, summarized, tabulated and compared with values from the previous February 10th 2025 release reflecting January 2025 costs and production data as applicable. Monthly comparisons of production data and costs are based on revised USDA values.
VOLUMES OF PRODUCTION REFLECTING THE ENTIRE INDUSTRY
|
PARAMETER
|
JANUARY 2025
|
FEBRUARY 2025
|
|
Table-strain eggs in incubators
|
52.4 million* (Jan.)
|
56.0 million (Feb.)
|
|
Pullet chicks hatched
|
26.6 million* (Dec.)
|
28.1 million (Jan.)
|
|
Pullets to be housed 5 months after hatch
|
23.7 million* (May.)
|
24.4 million (June)
|
|
EIC 2025 December 1st U.S. total flock projection
|
317.3 million (Jan.)
|
315.3 million (Feb.)
|
|
National Flock in farms over 30,000
|
291.9 million* (Dec.)
|
282.2 million (Jan.)
|
|
National egg-producing flock
|
308.2 million* (Dec.)
|
297.8 million (Jan.)
|
|
Cage-free flock excluding organic
Cage-free organic flock
|
101.0 million (Jan.)
20.3 million (Jan.)
|
103.6 million (Feb.)
20.5 million (Feb.)
|
|
Proportion of flocks in molt or post-molt
|
12.1%* (Jan.)
|
12.7% (Feb.)
|
|
Total of hens in National flock, 1st cycle (estimate)
|
270.9 million (Dec.)
|
260 million (Jan.)
|
*USDA Revised
|
Total U.S. Eggs produced (billion)
|
7.83 December 2024
|
7.57 January 2025
|
|
Total Cage-Free hens in production
Proportion of organic population
|
121.3million (Jan.)
16.7% Organic
|
124.2 million (Feb.)
16.5% Organic
|
|
“Top-5” States hen population (USDA)1
|
144.7 million (Dec.)
|
139.3 million (Jan.)
|
- Revised USDA/EIC Note 1. Texas excluded to maintain confidentiality
PROPORTION OF U.S. TOTAL HENS BY STATE, 2024
Based on a nominal denominator of 282 million hens in flocks over 30,000 covering 95 percent of the U.S complement.
USDA has amended inclusion of specific states in regions and eliminated Texas data to protect confidentiality of Company flock
Sizes
|
STATE
|
DECEMBER1
2024
|
JANUARY
2025
|
|
Iowa
|
14.3%
|
14.0%
|
|
Indiana
|
12.6%
|
13.1%
|
|
Ohio
|
14.4%
|
14.1%
|
|
Pennsylvania
|
8.2%
|
8.1%
|
|
Texas (estimate)
|
7.2% ?
|
7.0%?
|
|
California
|
1.5%
|
1.0%
|
- Values rounded to 0.1%
(insert Fig 10 leading states)
Rate of Lay, weighted hen-week (USDA) 81.7%* January 2025. 82.3% January 2025
*Revised USDA
|
Revised per capita
|
Egg consumption 2020
|
285.6 (down 7.8 eggs from 2019)
|
|
Revised per capita
|
Egg consumption 2021
|
282.5 (down 3.1 eggs from 2020)
|
|
Actual per capita
|
Egg consumption 2022
|
280.5 (down 2.0 eggs from 2021 due to HPAI)
|
|
Actual per capita
|
Egg consumption 2023
|
279.3 (down 1.2 eggs from 2022)
|
|
Projected per capita
Forecast per capita
|
Egg consumption 2024
Egg consumption 2025
|
273.8 (down 5.5 eggs from 2023) attributed to HPAI losses)*
270.7 (down 3.1 eggs from 2024) forecast regarded as aspirational, was 275.9 last month
|
*Revised, using data from USDA Livestock, Dairy and Poultry Outlook February 18th 2025 taking into account demand from the food service sector and presumably including the effect of HPAI depopulation.
EGG INVENTORIES AT BEGINNING OF February 2025:
|
Shell Eggs
|
1.43 million cases down 8.6 percent from January 2025
|
|
Frozen Egg
Products
|
450,258 case equivalents, down 4.9 percent from January 2025
|
|
Dried Egg
Products
|
Not disclosed since March 2020 following market disruption due
To COVID. Moderate levels of inventory are assumed.
|
EGGS BROKEN UNDER FSIS INSPECTION (MILLION CASES) December 2024, 6.08* January 2025, 5.87
|
Cumulative eggs broken under FSIS inspection 2024 (million cases)
|
77.2
|
JAN. TO DEC.
|
|
Cumulative 2024: number of cases produced (million)
|
257.9
|
JAN. TO DEC.
|
|
Cumulative 2024: proportion of total eggs broken
|
29.9%
|
(30.8% 2022)
|
|
|
|
|
|
Cumulative eggs broken under FSIS inspection 2025 (million cases)
|
5.9
|
JAN.
|
|
Cumulative 2025: number of cases produced (million)
|
21.0
|
JAN.
|
|
Cumulative 2025: proportion of total eggs broken
|
27.9%
|
JAN.
|
EXPORTS JANUARY 2025: (Expressed as shell-equivalent cases of 360 eggs).
|
Parameter
|
Quantity Exported
|
|
Exports:
|
2024 2025
|
|
Shell Eggs (thousand cases)
|
DEC. 278. JAN. 239
|
|
Products (thousand case equivalents)
|
DEC. 161. JAN. 130
|
|
TOTAL (thousand case equivalents)*
|
DEC. 439. JAN. 369
|
*Representing 1.8 percent of National production in JANUARY 2025 (1.1% shell, 0.6% products).
COSTS AND UNIT REVENUE VALUES1 FOR CONVENTIONAL EGGS FROM CAGED HENS
|
Parameter
|
JANUARY 2025
|
FEBRUARY 2025
|
|
4-Region Cost of Production ex farm (1st Cycle)
|
76.1 c/doz
|
76.1 c/doz
|
|
Low
|
73.5c/doz (MW)
|
73.7 c/doz (MW)
|
|
High
|
78.1 c/doz (NE)
|
77.9 c/doz (NE)
|
Notes: 1. Excludes SW and West
Components of Production cost per dozen:-
|
|
JANUARY 2025
|
FEBRUARY 2025
|
|
Feed
|
36.2 c/doz
|
36.2c/doz
|
|
Pullet depreciation
|
12.0 c/doz
|
12.0c/doz
|
|
Labor (estimate) plus
|
|
|
|
Housing (estimate) plus
|
27.9c/doz
|
27.9c/doz
|
|
Miscellaneous and other (adjusted May 2023)
|
|
|
Ex Farm Margin (rounded to nearest cent) according to USDA values reflecting FEBRUARY 2025:-
740.0 cents per dozen1- 76.1 cents per dozen = 663.9 cents per dozen (January 2025 comparison: 582.0 cents per dozen – 76.1 cents per dozen = 505.9 cents per dozen.
Note 1: USDA Blended nest-run egg price
|
|
|
JANUARY 2025
|
FEBRUARY 2025
|
|
USDA
|
Ex-farm Price (Large, White)
|
582.0 c/doz (Jan.)
|
740.0c/doz (Feb.)
|
|
|
Warehouse/Dist. Center
|
641.0 c/doz (Jan.)
|
820.0c/doz (Feb.)
|
|
|
Store delivered (estimate)
|
646.0 c/doz (Jan.)
|
826.0 c/doz (Feb.)
|
|
|
Dept. Commerce Retail1 National
|
415.0 c/doz (Dec.)
|
495.0 c/doz (Jan.)
|
|
|
Dept. Commerce Retail1 Midwest
|
416.0 c/doz (Dec.)
|
482.0 c/doz (Jan.)
|
1. Unrealistic USDA prices based on promotional prices with few participating stores, non-representative of shelf prices!
(insert Fig 2 Farm egg value, Fig 3 Consumer retail, Fig 4 Estimated quarterly)
|
|
JANUARY 2025
|
FEBRUARY 2025
|
|
U.S. Av Feed Cost per ton
|
$233.04
|
$232.93
|
|
Low Cost – Midwest
|
$209.87
|
$209.87
|
|
High Cost – West
|
$269.74
|
$269.74
|
|
Differential
|
$ 59.87
|
$ 59.87
|
|
Pullet Cost 19 Weeks
|
$4.71 JANUARY 2025
|
$4.65 FEBRUARY 2025
|
|
Pullet Cost 16 Weeks
|
$4.10 JANUARY 2025
|
$4.10 FEBRUARY 2025
|
COSTS AND UNIT REVENUE FOR EGGS FROM CAGE-FREE HENS
|
Parameter
|
JANUARY 2025
|
FEBRUARY 2025
|
|
5-Region Cost of Production ex farm (1st Cycle)
|
95.3 c/doz
|
95.3 c/doz
|
|
Low
|
90.7c/doz (MW)
|
90.9 c/doz (MW)
|
|
High
|
102.7 c/doz (West)
|
102.5 c/doz (West)
|
Components of Production cost for cage-free eggs, per dozen:-
|
|
JANUARY 2025
|
FEBRUARY 2025
|
|
Feed
|
41.7 c/doz
|
41.7 c/doz
|
|
Pullet depreciation
|
15.8 c/doz
|
15.8 c/doz
|
|
Labor (estimate) plus
|
|
|
|
Housing (estimate) plus
|
37.8c/doz
|
37.8 c/doz
|
|
Miscellaneous and other
|
|
|
Ex Farm Margin (rounded to nearest cent) according to USDA values reflecting negotiated price for FEBRUARY 2025:-
Cage-Free brown 916.0 cents per dozen1- 95.3 cents per dozen = 820.7 cents per dozen
January 2025:- 809.0 cents per dozen - 95.3 cents per dozen = 713.7 cents per dozen
|
|
|
JANUARY 2025
|
FEBRUARY 2025
|
|
USDA
|
USDA Average Ex-farm Price1
|
170 c/doz (Jan.)
|
170 c/doz (Dec.)
|
|
|
Warehouse/Dist. Center2
|
809 c/doz (Jan.)
|
916 c/doz (Feb.)
|
|
|
Store delivered (estimate)
|
814 c/doz (Jan.)
|
922 c/doz (Feb.)
|
|
|
Dept. Com. Retail3 C-F Brown
Dept. Com. Retail3 C-F White
|
289 c/doz (Jan.)
449 c/doz (Jan.)
|
799 c/doz (Feb.)
Not disclosed (Feb.)
|
|
|
Dept. Com. Retail3 Organic
Dept. Com. Retail3 Pasture
|
547 c/doz (Jan.)
668 c/doz (Jan.)
|
537 c/doz (Feb)
675 c/doz (Feb.)
|
1. Contract price, nest-run loose. Range 135 to 235 c/doz. unchanged since July and totally unrealistic.
- Negotiated price, loose. Range $6.00 to $8.98 per dozen
- Unrealistic USDA values based on promotional prices with few participating stores non-representative of shelf prices!
|
Cage-Free* Pullet Cost 19 Weeks
|
$5.64 JANUARY 2025
|
$5.64 FEBRUARY 2025
|
|
Cage-Free* Pullet Cost 16 Weeks
|
$4.94 JANUARY 2025
|
$4.93 FEBRUARY 2025
|
* Conventional (non-organic) feed
Feed prices used are the average national and regional values for caged flocks. Excludes organic feeds with prices substantially higher than conventional.
|
USDA Data on Cage-Free Production for February 2025
|
03/06/2025 |
|
 This update of U.S cage-free production is sponsored by Big Dutchman USA for the benefit of producers in North America This update of U.S cage-free production is sponsored by Big Dutchman USA for the benefit of producers in North America
Depopulation was carried out as required through the fourth quarter of 2024 and has continued through 2025 to date as a result of HPAI. The USDA Cage-Free Report covering February 2025, released on March 3rd 2025, documented the complement of hens producing under the Certified Organic Program to be 20.5 million (rounded to 0.1 million), up 0.1 million from January 2025. The number of hens classified as cage-free (but excluding Certified Organic) and comprising aviary, barn and other systems of housing apparently increased by 2.7 million hens or 2.7 percent from January 2025 to 103.7 million, despite extensive flock depopulation during the month.
Average weekly production for Certified Organic eggs in February 2025 was up 1.1 percent compared to January 2025 with a questionably high average weekly production of 84.0 percent. Average weekly flock production for cage-free flocks other than Certified Organic was up 3.3 percent in February 2025, but with a high average hen-month production of 82.7 percent, up from 82.6 percent. Seasonally, younger flocks increase the availability of cage-free and organic eggs in response to pullet chick placements 20 weeks previously especially in anticipation of periods of peak seasonal demand.
According to the USDA Egg Markets Overview the categorization of flocks according to housing system among the total of 292 million hens on
February 1st was:-
Caged, 169 million (57.2% of 292 million hens on February 1st.);
Cage Free, 102 million (34.9%) with 87% in barns and 8% each on free-range and pasture;
Organic, 21 million (7.2%) with 5% each on free-range and pasture:
There is no adequate explanation for the high production rate especially if the reported number of hens is lower than actual, and in view of a possible undercount following HPAI flock depopulation.
|
Flock Size Average
(million hens)
|
February
2025
|
Average
Q4-2024
|
Average
Q3- 2024
|
Average
Q2 –
2024
|
Average
Q1 –
2024
|
Average
Q4-
2023
|
|
Certified Organic
|
20.5
|
20.5
|
20.0
|
18.8
|
18.3
|
18.7
|
|
Cage-Free Hens
|
103.7
|
104.5
|
103.9
|
101.0
|
105.7
|
106.4
|
|
Total Non-Caged
|
124.2
|
125.0
|
123.9
|
119.8
|
124.0
|
125.1
|
|
Average Weekly Production (cases of 360 eggs)
|
January
2025
|
February
2025
|
|
Certified Organic @ 83.8% hen/day
|
330,252
|
334,032 +1.1%
|
|
Cage-Free @ 82.6% hen/day
|
1,613,998
|
1,667,366 +3.3%
|
|
Total Non-Caged @ 82.8% hen/day
|
1,944,250
|
2,001,398 +2.9%
|
|
Average Nest Run Contract Price Cage-Free Brown
|
$1.70/doz. (Unchanged since July 2024)
|
|
February 2025 Range:
|
$1.35 to $2.35/doz. (unchanged since March 2023)
|
|
FOB Negotiated January price, grade-ready quality, loose nest-run. Price range $7.50 to $9.00 per dozen
|
Average February 2025 Value of $7.77/doz. ($7.24/doz. January 2025)
|
|
Average February 2025 Advertised promotional National Retail Price C-F, Large Brown
|
$7.99/doz. February 2025 (4 regions)
(was $2.88/doz. in January 2025)
|
|
USDA Based on 4 Regions, 62 stores
Only NE, SE, MW & SC. (was 133 stores offering promotions)
|
Each Region, $7.99 /doz.
|
 Negotiated nest-run grade-ready cage-free price for February 2025 averaged $7.74 per dozen, up 6.9 percent from $7.24 per dozen in January 2025, reflecting an imbalance between demand relative to supply. The February 2025 advertised U.S. featured retail price for cage-free eggs over only four regions (NE, SE, MW & SC.) was $7.99 per dozen, apparently up $5.11 per dozen from January 2025 based on 62 stores. This compares with 133 stores in January and reflects fewer promotions as the year has progressed reflecting the ongoing incidence rate of HPAI. Negotiated nest-run grade-ready cage-free price for February 2025 averaged $7.74 per dozen, up 6.9 percent from $7.24 per dozen in January 2025, reflecting an imbalance between demand relative to supply. The February 2025 advertised U.S. featured retail price for cage-free eggs over only four regions (NE, SE, MW & SC.) was $7.99 per dozen, apparently up $5.11 per dozen from January 2025 based on 62 stores. This compares with 133 stores in January and reflects fewer promotions as the year has progressed reflecting the ongoing incidence rate of HPAI.
The recorded average wholesale price of $7.77 per dozen plus a provision of 60 cents per dozen for packaging, packing and transport, results in a price of $8.37 per dozen delivered to CDs. The average four-region advertised retail price of $7.99 per dozen corresponds to a theoretical average retail negative margin of 4.8 percent (-172.4 percent last month) for promotions offered by the few stores featuring cage-free eggs. Margins are presumed higher for non-featured eggs including pastured and other specialty eggs at shelf prices attaining in excess of $9.00 per dozen in high-end supermarket chains. Retailers maximizing margins especially on Certified Organic, free-range and pastured categories restrict the volume of sales, ultimately disadvantageous to producers.
|
Biosensor Developed to Detect Aerosolized H5N1 Avian Influenza
|
03/06/2025 |
|
 A research team representing diverse engineering and medical disciplines at the Washington University in St. Louis, has developed a capacitive biosensor to detect airborne H5N1 avian influenza virus. A research team representing diverse engineering and medical disciplines at the Washington University in St. Louis, has developed a capacitive biosensor to detect airborne H5N1 avian influenza virus.
Virus entrained in air was collected in a wet cyclone with an aliquot of liquid containing virus applied to the biosensor platform. Using serial dilutions, it was possible to assess the in vitro sensitivity and specificity of the detection system suggesting that the technology could be applied as a cost-effective method of rapidly detecting the presence of airborne H5N1.
Kumar, J., et al, Capacitive Biosensor for Rapid Detection of Avian (H5N1) Influenza and E. Coli in Aerosols. ACS Sensors doi.org/10.102/ACS Sensors.4c 03087 2025
|
Inadequate and Theoretical CDC Recommendations to Prevent Zoonotic Avian Influenza
|
03/06/2025 |
|
 In a recent release, the Centers for Disease Control and Prevention (CDC) noted, “The best way to prevent H5N1 bird flu is to avoid sources of exposure whenever possible. For people who must have direct or close contact with infected or potentially infected animals help limit exposure to avian influenza viruses using CDC recommendations including personal protective equipment.” In a recent release, the Centers for Disease Control and Prevention (CDC) noted, “The best way to prevent H5N1 bird flu is to avoid sources of exposure whenever possible. For people who must have direct or close contact with infected or potentially infected animals help limit exposure to avian influenza viruses using CDC recommendations including personal protective equipment.”
This recommendation may have seemed appropriate sitting in an office in Atlanta away from the reality of dead birds, dust and feathers. More likely it was Bowdlerized by HSS functionaries attempting to impose distortions and omissions in scientific reality through CDC releases.
If the USDA continues to conduct depopulation as a measure of control for avian influenza, field workers, many illiterate and uninformed of the risks of exposure, will be required to operate under hot conditions and in close contact with dead and dying birds. Despite being provided with masks and respirators, PPE may not be correctly used. Up to 80 workers were infected with H5N1 on dairy and poultry farms in 2024. Surveillance is minimal and the extent of infection is probably understated.
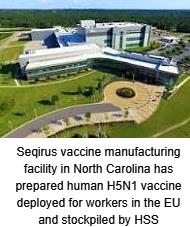
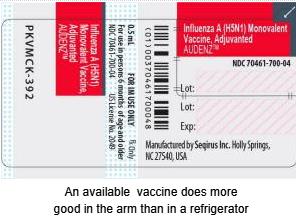 Surely all workers coming into contact with dairy herds in areas of high prevalence and especially involved in depopulation of infected flocks, should receive the available H5N1 human vaccine in addition to the seasonal trivalent human influenza immunization. Allowing susceptible workers to come into contact with high levels of H5N1 virus increases the risk of emergence of a mutant, zoonotic strain with human-to-human transmission or initiating the possibility of a recombinant event. Surely all workers coming into contact with dairy herds in areas of high prevalence and especially involved in depopulation of infected flocks, should receive the available H5N1 human vaccine in addition to the seasonal trivalent human influenza immunization. Allowing susceptible workers to come into contact with high levels of H5N1 virus increases the risk of emergence of a mutant, zoonotic strain with human-to-human transmission or initiating the possibility of a recombinant event.
|
Activists’ Response to USDA Five-Pronged HPAI Strategy
|
03/06/2025 |
|
Wayne Pacelle of Animal Wellness Action posted a strong response to the February 26th “Five-pronged Strategy” announced by Secretary Brooke Rollins to suppress the ongoing epornitic of H5N1 avian influenza. Pacelle correctly points to the futility of a three-year program of attempting to “stamp out” infection responsible for depopulation of approximately 130 million hens and pullets since the emergence of the disease in 2022.
Dr. Jim Keen, Director of Veterinary Science for the Center for a Humane Economy affiliated with the organization run by Pacelle, is a strong advocate of vaccination. He stated, “It is astonishing to me that Secretary Rollins is talking about “exploration of a vaccine and therapeutics when what’s needed is on-the-ground implementation of vaccination.” He added, “There is no need and no time for further R&D on poultry bird flu vaccines as excellent H5 vaccines are readily available commercially.”
It is seldom that EGG-NEWS shares common sentiment with welfare activists but their call for initiation of vaccination of laying hens and turkeys is valid. Dr. Keen correctly maintains that establishing and maintaining flock immunity is preferable to an ongoing and rolling program of depopulation.
Pacelle stated, “Secretary Rollins is genuflecting to the demands of the trade association representing the broiler industry.” He added, “The National Chicken Council is opposing a vaccination strategy in the United States even through vaccination is conducted in China, F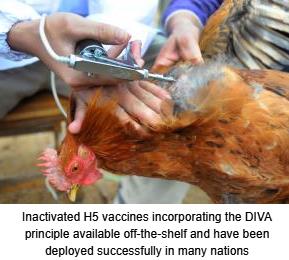 rance, Mexico and other countries and appears to be a key factor in limiting the spread of disease and death in birds.” It is clearly evident that HPAI is endemic in the U.S., having been diagnosed in all 50 states and has persisted since 2022 with a large reservoir of migratory waterfowl and more recently domestic birds and small mammals in addition to dairy herds. rance, Mexico and other countries and appears to be a key factor in limiting the spread of disease and death in birds.” It is clearly evident that HPAI is endemic in the U.S., having been diagnosed in all 50 states and has persisted since 2022 with a large reservoir of migratory waterfowl and more recently domestic birds and small mammals in addition to dairy herds.
Based on the epidemiologic realities EGG-NEWS finds common cause with these activists in calling for a structured program of flock protection using available vaccines. This prevention modality should be directed to turkeys and egg-production flocks in high-risk areas. Any program should be accompanied by surveillance to monitor immunity and to dect possible emergence of infection in accordance with World Organization of Animal Health policies that permit trade with vaccination.
|
Efficacy of Vectored AI Vaccines Demonstrated in Holland
|
03/05/2025 |
|
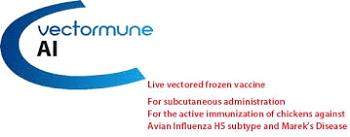 Wageningen University has recently published on evaluation of two live vectored vaccines to provide protection against H5 avian influenza. The studies were sponsored by the Ministry of Agriculture, Fisheries, Food Security and Nature of the Netherlands, after laboratory evaluation showed efficacy and safety. Wageningen University has recently published on evaluation of two live vectored vaccines to provide protection against H5 avian influenza. The studies were sponsored by the Ministry of Agriculture, Fisheries, Food Security and Nature of the Netherlands, after laboratory evaluation showed efficacy and safety.
The field trial comprised two farms each holding 1,800 hens. The trial compared Vectormune® AI or Vaxxitek® HVT+IBD+H5 against non-vaccinated controls. Chicks were vaccinated in September 2023 and the longitudinal study will continue through early 2025.
 Day-old chicks received either of the vaccines by injection at day of hatch with some pullets receiving an additional booster vaccination at 12 weeks of age. Irrespective of vaccine applied, at 8 weeks of age, all pullets were protected against challenge with a circulating field strain of H5N1 HPAI under controlled laboratory conditions. A second challenge was conducted at 24 weeks of age.. Hens receiving either of the vaccines at day-old showed 10 percent mortality on challenge. Hens receiving both the day-old vaccine and in addition the 12-week booster were clinically unaffected and all survived challenge. Viral shedding following challenge was sharply decreased in the vaccinated treatments. Non-vaccinated controls showed 100 percent mortality. Day-old chicks received either of the vaccines by injection at day of hatch with some pullets receiving an additional booster vaccination at 12 weeks of age. Irrespective of vaccine applied, at 8 weeks of age, all pullets were protected against challenge with a circulating field strain of H5N1 HPAI under controlled laboratory conditions. A second challenge was conducted at 24 weeks of age.. Hens receiving either of the vaccines at day-old showed 10 percent mortality on challenge. Hens receiving both the day-old vaccine and in addition the 12-week booster were clinically unaffected and all survived challenge. Viral shedding following challenge was sharply decreased in the vaccinated treatments. Non-vaccinated controls showed 100 percent mortality.

Bouwman, K.M. et al Progress report: Transmission study testing HVT-based H5 vaccine against highly pathogenic avian influenza (HPAI) H5N1 virus (clade 2.3.4.4b). Wageningen Bioveterinary Research Publications September 2024 doi: 10.18174/669647
|
Sequencing of H5N1 Virus Isolates from Farm Workers
|
03/04/2025 |
|
T he Centers for Disease Control and Prevention has completed sequencing studies on viruses isolated from workers in contact with infected poultry in Nevada and Wyoming. Genetic sequences have been posted on GISAID, an international database. he Centers for Disease Control and Prevention has completed sequencing studies on viruses isolated from workers in contact with infected poultry in Nevada and Wyoming. Genetic sequences have been posted on GISAID, an international database.
The virus isolated from the Nevada patient was characterized as genotype D1.1 consistent with contact with dairy cows. This virus demonstrated a mutation in the polymerase protein encoded  by (D701N) that is associated with more efficient replication in mammalian cells. A similar change was previously noted in a human case following contact with infected poultry in Chile in 2023. by (D701N) that is associated with more efficient replication in mammalian cells. A similar change was previously noted in a human case following contact with infected poultry in Chile in 2023.
The Wyoming patient was infected with H5N1 clade 2.3.4.4.b genotype D1.1. This virus demonstrated a change designated E627K in encoding for polymerase. This mutation is associated with enhanced viral replication in mammals was noted in the initial human cases in Texas during March 2024. Both viruses were demonstrated to be susceptible to current antiviral medications administered for influenza.
|
Big Dutchman Special Edition
|
02/25/2025 |
|
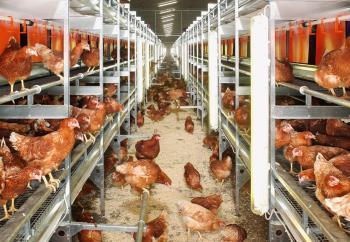
NATURA® STEP AVIARY SYSTEMS
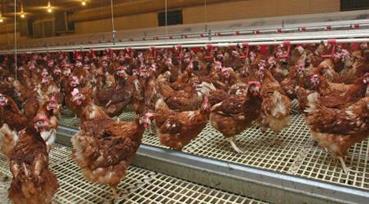
The Big Dutchman NATURA® Step and Step XL aviary systems are state-of-the-art installations designed to optimize flock production and achieve the highest proportion of sellable eggs from a flock. The NATURA® Step and Step XL systems can be retrofitted to existing houses or incorporated into the design of new multi-level buildings. The NATURA® Step configuration comprises a lower tier with feeding and watering, floor access, and perch space, a middle tier with nests and drinkers, and an upper tier with feeding, floor access, and perches.
The NATURA® Step and Step XL are true aviary systems that allow hens access to all levels and the aisles, allowing natural behaviors including foraging, dust bathing, roosting, feeding, and egg laying within the aviary.
The Step concept is based on strategically placed platforms allowing hens to move easily among tiers, compliant with both E.U. and U.S. welfare requirements. The Step configuration of tiers together with the platforms allows hens to alight and turn for ease of access when moving up or down the installation.
NATURA® Step aviary systems offer the potential for maximum return on investment through harmonizing design with the behavioral requirements and genetic potential of flocks.
The NATURA® Step is 108 inches in height and has an overall width of 96 inches. The system incorporates a single row of nests on the middle tier. The NATURA® Step XL is 96 inches in height and has a width of 117 inches with two rows of nests on the middle tier to allow for optimal accessibility.
House equipped with Natura STEP aviary. Even distribution of flock among tiers and aisles |
NESTS
Hens enter nests across a staging area equipped with a line of feeders and drinkers. Nests incorporate a patented tilting floor. Before the nest commences the closing sequence, it is raised slightly in the center allowing any eggs on the pad to roll towards the egg belt. To transition to the closed position, the nest floor is rotated through 90° facilitating removal of adherent dirt. In the closed position, hens are excluded from nests to prevent soiling and prevent “broody” hens.
The NATURA® Step is equipped with a single wide egg belt. The NATURA® Step XL has two parallel wide belts allowing for clean storage during periods of non-collection. Transport to the elevators is smooth and supports shell integrity. Belts are fabricated from polypropylene and will withstand high loading for prolonged functional life.
An optional belt can be installed on each side of the nest area to collect the small number of eggs laid on the floors of the system.
EGG TRANSPORT
The EGGTRAX™ transfer unit gently moves eggs from the collection belt through a short transfer conveyor using pressure fingers to maintain shell integrity. The EGGCELLENT™ elevator is designed for high-volume collection. The design incorporates interlocking plastic components to optimize the yield of sellable eggs.

Double collecting belt arrangement below nest tier of Natura STEP XL ensures smooth and rapid transfer of eggs to elevators
|
FEEDING
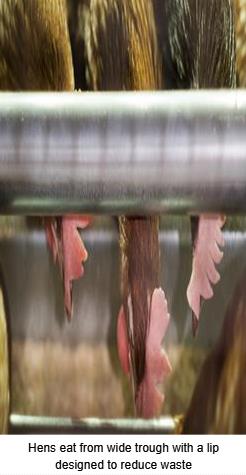 Both Step systems incorporate the proven CHAMPION™ Chain feeding system equipped with an extra-wide trough with a lip designed to reduce feed wastage. The NATURA® Step has a single circuit on each of the lower and upper tiers with an optional circuit above the upper tier. The NATURA® Step XL is equipped with a circuit on the lower tier and two circuits on the upper tier. Both Step systems incorporate the proven CHAMPION™ Chain feeding system equipped with an extra-wide trough with a lip designed to reduce feed wastage. The NATURA® Step has a single circuit on each of the lower and upper tiers with an optional circuit above the upper tier. The NATURA® Step XL is equipped with a circuit on the lower tier and two circuits on the upper tier.
WATER SUPPLY
Nipple drinker lines are installed on the lower tier and above the entrance to nests on the middle tier. Stainless steel nipples deliver water 360º, and units are equipped with drip cups.
LIGHTING
Flexibility in the management of the flock and regulation of production is attained with lighting above the aisles, within and under each row.
MANURE HANDLING
The NATURA® Step aviary is designed to encourage hens to face towards the aisle while roosting, directing manure to the collection belt contributing to dry litter in the aisles and low levels of ammonia.
The top and bottom tiers are equipped with polypropylene manure belts with the option of ventilation to reduce moisture content. With correct operation, the system can maintain low levels of ammonia and freedom from fly infestation.
Additional information about these systems is available by clicking on the Big Dutchman logo at the top of this article. Design projections for either retrofits or new houses are available from regional sales representatives or an authorized Big Dutchman distributor.
|
|
|
|
View More
|
Top
|
|