USDA Weekly Egg Price and Inventory Report, June 22nd 2023.
 Market Overview
- The average wholesale unit revenue values for Midwest Extra-large and Large sizes were unchanged this past week but represented a lower than seasonal late spring value. The plateau over three weeks signifies a market pause, terminating the precipitous decline over the preceding six weeks. Mediums were up 1.0 percent, albeit a sub-breakeven price with a 10-cent per dozen price differential from Large. This suggests restoration in the balance between supply and demand in this size. This past week shell egg inventory was down 5.9 percent, compared to a fall of 1.3 percent last week. This is consistent with presumably higher demand as shelf prices for generics fall. Over the coming week into the July 4th holiday the volume of retail purchases will be influenced by seasonal demand. As chains reduce margins consistent with wholesale prices, higher demand can be anticipated. Eggs are now highly competitive in price against the comparable costs for other protein foods despite unrealistic retail margins imposed by some chains.
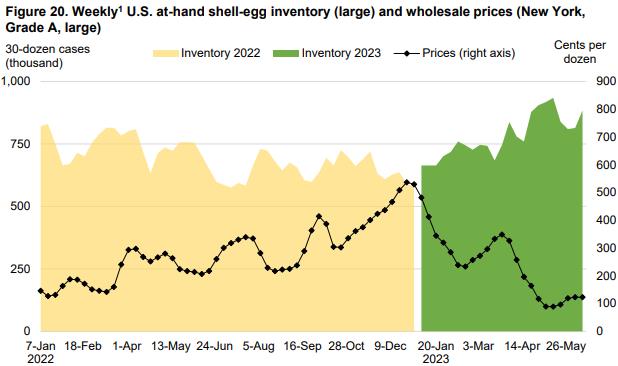
- Total industry inventory was down by 4.3 percent overall this past week to 1.69 million cases with a concurrent 4.5 percent increase in breaking stock attributed to diversion to the shell market and presumably higher demand during early summer from food service, manufacturers and increased exports. Volume this past week was stimulated by lower prices for egg products. Wholesale shell egg prices compare with 2020 and 2021, also characterized by low ex-plant unit revenue. Benchmark prices were $0.85 per dozen lower than for the corresponding week in 2022, inflated by flock depletions following HPAI.
- It is now apparent that the inventory held by chains and other significant distributors may be more important over the short term in establishing wholesale price than the USDA regional inventory figures published weekly. This is probably the reason for fluctuation in weekly industry stock although a downward trend is evident in this parameter.
- Despite a lower flock size as a result of HPAI, relatively low unit revenue compared to pre-HPAI will now be a reality through the remainder of June 2023. Sporadic outbreaks of HPAI are now unlikely given that the seasonal Spring migration of waterfowl is complete. The number and extent of future outbreaks during late fall and early winter of 2023 cannot be assessed until more information is available concerning the molecular and field epidemiology of the 2022 spring and fall waves of HPAI. The USDA has yet to identify modes of transmission for the 2022 epornitic including airborne spread. The USDA-APHIS Center for Epidemiology released interim results of case-control studies on May 31st. This report failed to identify deficiencies in biosecurity on affected complexes that contributed to infection. APHIS has been remiss in collecting and evaluating available data and providing timely practical guidance on prevention. This is evidenced by releasing a backdated report during the first week of March 2023 and presenting a webinar on May 31st that was devoid of recommendations to prevent HPAI infection in flocks.
- The current relationship between producers and chain buyers based on a single commercial price discovery system constitutes an impediment to a free market. The benchmark price amplifies both downward and upward swings as evidenced over the past five weeks. A CME quotation based on Midwest Large, reflecting demand relative to supply would be more equitable. If feed cost is determined by CME ingredient prices then generic shell eggs should be subject to a Midwest Large quotation.
- According to the USDA the U.S. flock in production was down less than 0.1 percent or 0.1 million hens to 307.2 million during the week ending June 21st. The flock in production included about 3.0 to 4.0 million molted hens that resumed lay during the past week plus 4.0 to 5.0 million pullets attaining production. Given the latest figures it is estimated that the producing flock is still 10 to 12 million hens lower than before the onset of HPAI.
- The ex-farm price for breaking stock on June 20th was up 35.1 percent this past week to 89 cents per dozen.Checks delivered to Midwest plants were up 26.0 percent to 82 cents per dozen. Prices for breaking stock will remain low until there is a substantial increase in wholesale price for shell eggs.
The Week in Review
Prices
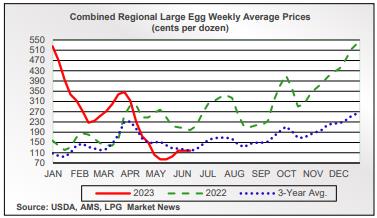
According to the USDA Egg Market News Reports released on June 20th the Midwest wholesale price (rounded to one cent) for Extra-large was unchanged from last week at $1.13 per dozen. Large size was also unchanged at $1.11 per dozen. The price for Medium size was up 1.0 percent to $1.01 per dozen as delivered to DCs. Prices should be compared to the USDA benchmark average 6-Region blended nest-run cost of 86.9 cents per dozen as determined by the EIC for May 2023. This excludes provisions for packing, packaging materials and transport, amounting to 47 cents per dozen in mid-2022, according to the EIC but now probably closer to 52 cents per dozen. Accordingly producers of generic shell eggs are operating with negative margins. The progression of prices during 2023 to date is depicted in the USDA chart reflecting three years of data, updated weekly.
The June 20th 2023 edition of the USDA Egg Market News Report documented a USDA Combined Region value rounded to the nearest cent, of $1.18 per dozen delivered to warehouses for the week ending June 20th 2023. This average price lags current Midwest weekly values by one week. The USDA Combined range for Large in the Midwest was $1.19 per dozen. At the high end of the range, the price in the South Central region attained $1.25 per dozen. The USDA Combined Price last week corresponded to the 3-year average of $1.35 per dozen. This past week Midwest Large was approximately $0.85 below the corresponding week in 2022 elevated by losses due to HPAI.
Flock Size
According to the USDA the number of producing hens reflecting June 21st (rounded to 0.1 million) was down 0.1 million hens (<0.1 percent) to 307.2 million. This is a sharp contrast to the inexplicable increase of 5.0 million three weeks ago coupled with an apparent unrealistic increase of 8.6 million hens reported by the USDA six weeks ago. The total U.S. flock includes about 3.0 to 4.0 million molted hens due to return to production with approximately 4.0 to 5.0 million new pullets reaching maturity each week based on USDA monthly chick-hatch data for 20-weeks previously. The increase is offset by routine flock depletion in addition to residual losses during the fall 2022 phase of the 2022 HPAI epornitic. Based on inventory level and prices the hen population producing eggs should now be in relative balance with consumer demand. Industrial and food service off-take although increasing, has not reverted to pre-COVID levels. Prices will continue to fluctuate and are expected to stabilize at a low seasonal level through June 2023. Prices of shell eggs and products will also depend on any unlikely incident outbreaks of HPAI offset by the contribution of new pullets and of molted hens to supply.
According to the USDA the total U.S. egg-flock on June 21st was down 0.2 million hens (<0.1 percent) to 314.7 million including second-cycle birds and those in molt. Any difference between hens in production and total hens is an approximate figure but denotes that many molted hens resumed production in late May after a post-Easter molt. With lower benchmark wholesale prices older flocks have been molted or depleted. At present there are now at least 10 to 12 million fewer hens in both the total and producing flocks with the difference equivalent to about 3.5 percent of the pre-HPAI national flock of 325 million hens.
INVENTORY LEVELS
Cold storage stocks of frozen products in selected centers on June 19th 2023 amounted to 2.592 million pounds (1,178 metric tons) of frozen egg products, up 3.7 percent from the inventory of 2.500 million lbs. on June1st 2023. The monthly USDA Cold Storage Report below quantifies a reduction in the actual total stock level.
The most recent monthly USDA Cold Storage Report released on May 24th 2023 documented a total stock of 24.9 million pounds (11,337 metric tons) of frozen egg products on April 30th 2023. This quantity was up 11.2 percent from the April 30th 2022 value of 22.4 million pounds. April 30th 2023 frozen egg inventory was up 2.4 percent from the previous month ending March 31st 2023 attributed to presumably lower demand. Compared to April 30th 2022 yolk inventory was up 6.4 percent to 733 million lbs. on April 30th 2023.
A total of 88.1 percent of combined inventory (24.9 million lbs.) comprised the categories of “Whole and Mixed” (46.1 percent) and “Unclassified” (42.0 percent). The lack of specificity in classification requires a more diligent approach to enumerating and reporting inventory by the USDA
!More!
Shell Inventory
The USDA reported that the national stock of generic shell eggs effective June 20th 2023 was down 4.3 percent. The relative movement of stock over the past three weeks suggests increased consumer demand with retail prices reflecting the sharp seasonal fall in wholesale price commencing eight weeks ago. Combined with breaking stock, the total inventory of shell eggs in the industry is now at 1.69 million cases (1.77 million last week and 75,500 cases lower). The U.S. population of laying hens at this time is influenced by the number of older birds previously culled during the fall phase of the 2022 HPAI epornitic and includes the population unaffected by HPAI, flocks retained after molting (with an anticipated decrease in this category based on price) and started pullets from chick placements in late December 2022. Going forward, younger hens will assume a larger proportion of the national flock as more flocks are placed compensating for the flocks depleted due to HPAI.
Five of six USDA Regions reported lower stock levels this past week. The regions are listed in descending order of stock: -
- The Midwest Region was down 10.1 percent compared to the previous week to 471,100 cases.
- The Southeast Region was up 0.3 percent to 288,500 cases
- The South Central Region was down 1.2 percent to 253,400 cases
- The Northeast Region was down 3.4 percent to 191,800 cases
- The Southwest Region was down 12.6 percent to 110,000 cases.
- The Northwest Region was down 11.4 percent to 80,100 cases
The total USDA six-area stock of commodity eggs comprised 1,689,600 cases, down 4.3 percent, of which 82.5 percent were shell eggs (84.0 percent last week). The inventory of breaking stock was up 4.5 percent to 294,700 cases. Shell egg inventory was down 5.9 percent attaining 1,394,900 cases. This denotes increased shell egg demand compared to the previous week.
The higher level of breaking stock over the past two weeks is attributed to decreased conversion to egg powder and liquids for storage and export, less diversion to the shell egg market and lower demand for liquids by industry, food service and consumers. The average price for Midwest checks and breaking stock combined was 73.4 percent of the average value of Midwest Extra-large and Large shell eggs (56.1 percent last week) consistent with disproportionately lower prices for breaking stock and checks compared to shell eggs although with a narrow spread this past week. The differential can be compared to 80.0 percent in April 2022 reflecting the initial period of high demand for both shell eggs and breaking stock after the onset of HPAI. This past week the wholesale Midwest Extra-large and Large shell egg prices were unchanged compared to the combination of breaking stock and checks that were up 30.6 percent on average from the previous week. This demonstrates the respective demands for shell eggs and egg products. There is interconnectivity of the packing and breaking segments of the egg industry under circumstances of extreme disturbances in either supply (lower due to HPAI in 2022) or demand (higher during COVID in 2020). The price for breaking stock and for checks is influenced by the relative demand for generic shell eggs and contract obligations with breakers.
On June 20th 2023 the inventory of other than generic eggs amounting to 419,700 cases (down a noteworthy 10.8 percent from last week at 470,400 cases) among three categories (with the previous week in parentheses) comprised: -
- Specialty category, down 9.5 percent to 41,600 cases. (Was down 4.7% to 46,000 cases)
- Certified Organic, down 8.9 percent to 106,700 cases. (Was up 10.6% to 117,100 cases)
- Cage-Free category, down 11.7 percent to 271,400 cases. (Was down 6.1% to 307,300 cases)
Demand for cage-free product will not increase materially over the long term while generic eggs from caged flocks and some surplus down-classified cage-free eggs are on the shelf at $2.20 to $2.50 per dozen during normal supply conditions. Currently there is a wide differential in shelf price between generics on the one hand and the considerably higher priced omega-3 enriched, cage-free and pasture-housed products. That the higher priced egg categories will lose demand is supported by the findings of the comprehensive review relating to the transition from cages to alternative systems.*
Existing and proposed individual state legislation mandating sale of only cage-free eggs will support most of the completed and anticipated transition from cages but total re-housing will not be completed by the beginning of 2025, less than 17 months away and ultimately never as considered by most observers. The constitutional status of Proposition #12 was confirmed by SCOTUS in a May 11th 2023 decision with specific reference to the dormant Commerce Clause relating to interstate trade. Legislative initiatives to limit the impact of Proposition #12 on hog production are in progress. Many chains are reneging on or extending their time commitments to achieve an acceptable transition to cage-free eggs. With the current proportion of non-caged flocks and lower prices for generic cage-derived eggs, cage-free eggs are surplus to demand in some areas. Cage-free eggs are becoming a commodity in many markets subjected to the same price pressures as generic eggs from caged hens. Growth in demand for organic product has been static for months and stock levels are rising. Over the past three weeks, stock in this category exceeded 100,000 cases. Long-term demand for cage-free eggs is influenced by the relative shelf prices of the category in comparison with generic white-shelled eggs from caged flocks. At the other end of the price range, consumers will purchase less-expensive brown cage-free product over organic eggs when there is a differential in price greater than about $1.20 per dozen under normal balance between supply and demand. Similarly, consumers will traditionally purchase white-shelled generic eggs in preference to brown-shelled cage-free with a differential of over $1.20 per dozen.
*Caputo,V. et al The Transition to Cage-Free Eggs. February 2023
A comprehensive structured market research project on cage-free eggs has provided an indication of consumer willingness to pay for this attribute. The industry requires a study on other aspects including shell color, GM status and nutritional enrichment. Above all, agricultural economists should evaluate the impact of disruption in supply and demand arising from large-scale depopulation following HPAI in 2015 and for the 2022 HPAI epornitic extending through partial restoration of hen numbers but a disproportionate decline in wholesale price during the first quarter of 2023.
RELATIVE PRICES OF SHELL-EGG CATEGORIES
USDA-AMS posted the following national shell egg prices as available, for June 16th 2023 in the Egg Markets Overview report for dozen cartons with comparable prices in parentheses for the previous week: -
Retail
Large, in cartons generic white: $1.53 down 10.0 percent ($1.70)
Large, in cartons cage-free brown: $3.01 up 30.3 percent ($2.31)
Large C-F, California in Cartons: $1.81 up 1.7 percent ($1.78)
Wholesale
National loose, (FOB dock): $0.85 up 8.9 percent ($0.78)
NYC in cartons to retailer: $1.25 unchanged ($1.25)
Regional in cartons to warehouse June 9th:
Midwest $1.11 unchanged ($1.11)
Northeast $1.16 unchanged ($1.11)
Southeast $1.21 unchanged ($1.21)
South Central $1.25 unchanged ($1.25)
Combined $1.18 unchanged ($1.18)
WEEKLY ADVERTISED PRICES OF SHELL-EGG CATEGORIES
USDA Certified Organic, Brown, Large: (none) ($3.99)
Cage-Free Brown, Large: $3.88 ($3.00)
Omega-3 Enriched Specialty, White, Large: $2.82 ($3.31)
Generic White, Large Grade A $1.83 ($1.80)
Generic White, Large Grade A featured $1.53 ($1.70)
The advertised price over 1,215 stores posted for the week ending June 13th for Large white grade A was $1.83 per dozen, up $0.03 per dozen or 1.7 percent from the previous week at $1.80 per dozen. Shelf prices will influence demand for generic categories given their availability and the comparison with higher advertised and actual shelf prices for specialty and cage-free brown eggs. Current supply was probably in balance with demand this past week as independent producers continue to divert shell eggs from breaking to market. Large integrated companies and packers continued to deliver to DCs at lower volumes as chains that held back on orders over five weeks. This was in anticipation of lower benchmark prices but buyers were faced with the need to replenish store and DC inventories despite increasing benchmark prices.
The USDA did not post a benchmark-advertised retail price for certified organic this past week The USDA posted an advertised price of $3.00 per dozen for cage-free brown during the past week. Although week-to-week fluctuations can be expected in the stock of specialty and organic eggs based on the small base of these categories, there is a pronounced downward trend in inventory this week as price-conscious consumers are buying all categories of eggs at lower prices including generics and caged eggs.
The price of cage-free brown at $3.86 per dozen was $1.87 per dozen higher than cage-free white at $1.99 per dozen.
Retail demand will continue to be supported by home cooking and baking and reinforced by seasonal dining out as COVID is now ignored. Eggs and product purchases will be limited among some demographics by their disposable incomes and inflation.
There was insufficient USDA data on shelf prices this week to calculate retail margins. Demand will increase as chains pass on any reduction in wholesale price for generic eggs.
Certified organic were not promoted this past week compared to 24 percent of promotions last week. Omega-3 enriched comprised 32.9 percent of features (31.7 percent last week) with cage-free at 13.4 percent (13.2 percent last week). Large at 53.7 percent (31.1 percent last week) represented the only generic size featured. This confirms that retailers promote any category if available in excess of demand.
USDA Cage-Free Data
According to the latest monthly USDA Cage-free Hen Report released on June 1st 2023, the number of certified organic hens during May 2023 was unchanged from April 2023 at 18.2 million.
The USDA reported the cage-free (non-organic) flock in May 2023 was 0.2 percent higher than in April 2023 to 103.4 million
According to the USDA the population of hens producing cage-free and certified organic eggs in May 2023 comprised: -
Total U.S. flock held for USDA Certified Organic production = 18.2 million (17.3 million in Q1 2023).
Total U.S. flock held for cage-free production = 103.4 million (98.1 million in Q1 2023).
Total U.S. non-caged flock =121.6 million (115.4 million in Q1 2023).
This total value represents 37.4 percent (last month 36.9 percent) of a nominal 325 million total U.S. flock pre-HPAI (but 39.1 percent of the national flock after HPAI mortality to a late April complement of 310 million). Hens certified under the USDA Organic program have decreased in proportion to cage-free flocks since Q1 of 2021.
The accuracy of individual monthly values is questioned given a history of either sharp changes or no change in successive months as documented over the past two years. Precise quarterly reports would be more suitable for the industry in planning expansion and allocation of capital.
Processed Eggs
For the processing week ending June 17th 2023 the quantity of eggs processed under FSIS inspection during the week as reported on June 21st 2023 was up 0.1 percent compared to the previous processing week to a level of 1,677,838 cases, (1,675,843 cases last week). The proportion of eggs broken by in-line complexes was 57.3 percent (56.5 percent in-line for the previous week) indicating a lower proportion of contract and purchased eggs broken. The differential in price for shell sales and breaking will determine the movement of uncommitted eggs. This past week 65.4 percent of egg production was directed to the shell market, (67.0 percent for the previous week) responding to the differential in prices paid by breakers and packers. Breaking stock inventory was up 4.5 percent this past week to 294,700 cases with diversion to shell-egg markets. Increased demand from QSRs and casual dining, with apparent continued demand from baking and eat-at-home has contributed in past weeks to a lower inventory of breaking stock. During the corresponding processing week in 2021 (during COVID recovery) in-line breakers processed 44.2 percent of eggs broken.
For the most recent monthly report for week ending June 3rd 2022, yield from 8,173,152 cases (76,075,770 cases last month) denoted an increase in demand for liquid over the period April 30th through June 3rd 2023. Edible yield was 36.3 percent, distributed in the following proportions expressed as percentages: - liquid whole, 60.0; white, 23.9; yolk, 12.3; dried, 3.8.
All eggs broken during 2022 attained 76.22 million cases, 2.0 percent less than 2021. Eggs broken in 2023 to date amounted to 36,066,684 cases, 0.4 percent less than the corresponding period in 2022. This is attributed to a decrease in demand for egg liquids from retail, food service and QSRs and casual dining restaurants, although the differential is narrowing. The market is constrained by economic uncertainty with the ending of COVID supports, inflation, high credit card interest rates and purchasing of only essentials by consumers
PRODUCTION AND PRICES
Breaking Stock
The average rounded price for breaking stock was up 35.1 percent this past week to an average of $0.89 per dozen with an extreme range of $0.61 to $0.70 per dozen delivered to Central States plants on June 20th. Checks were up 26.0 percent this past week to an average of $0.75 per dozen over the most frequent range of $0.74 to $0.76 per dozen suggesting that the market for breaking stock has outstripped shell eggs.
Shell Eggs
The USDA Egg Market News Report dated June 20th 2022 confirmed that Midwest wholesale prices for Extra-large, Large were unchanged from the previous week. Mediums were up 1.0 percent. The trend of consecutive sharply lower prices transitioned to a plateau coupled with declining stock for over two weeks suggests that the market has bottomed. The following table lists the “most frequent” ranges of values as delivered to warehouses*: -
|
Size/Type
|
Current Week
|
Previous Week
|
|
Extra Large
|
111-114 cents per dozen
|
unchanged
|
|
Large
|
109-112 cents per dozen
|
unchanged
|
|
Medium
|
100-103 cents per dozen
|
99-102 up 1.0%
|
|
Processing:-
|
|
|
|
Breaking stock
|
85-92 cents per dozen
|
61-70 up 35.1%
|
|
Checks
|
74-76 cents per dozen
|
59-60 up 26.0%
|
*Store Delivery approximately 5 cents per dozen more than warehouse price
The June 20th 2023 Midwest Regional (IA, WI, MN.) average FOB producer price, for nest-run, grade-quality white shelled Large size eggs, with prices in rounded cents per dozen was unchanged from last week, (with the previous week in parentheses): -
- $0.96 ($0.96), (estimated by proportion): L. $0.93 ($0.93): M. $0.82 ($0.81)
The June 20th 2023 California price per dozen for cage-free, certified Proposition #12 compliant Large size in cartons delivered to a DC, (with the previous week in parentheses) was up 17.1 percent from last week.
- $2.21 ($1.90); L. $2.12 ($1.81); M. $1.79 ($1.67)
Shell-Egg Demand Indicator
The USDA-AMS Shell Egg Demand Indicator for June 21stwas up 6.8 points from the last weekly report to -4.9 with a 4.3 percent decrease in total inventory and a 4.5 percent higher shell inventory from the past week as determined by the USDA-ERS as follows: -
|
Productive flock
|
307,147,743 million hens
|
|
Average hen week production
|
81.2%(was 81.0%)
|
|
Average egg production
|
249,486,343 per day
|
|
Proportion to shell egg market
|
65.4% (was 65.4%)
|
|
Total for in-shell consumption
|
453,326 cases per day
|
|
USDA Shell Inventory
|
1,394,900 cases
|
|
26-week rolling average inventory
|
4.64 days
|
|
Actual inventory on hand
|
4.88 days
|
|
Shell Egg Demand Indicator
|
-4.9 points (was -11.7 on June 14th 2023)
|
See the text, tables and figures and the review of production data and prices comprising the USDA Report for April 2023 and the 3rd Quarter FY 2023 results for Cal-Maine Foods under the Statistics Tab.
Dried Egg Products
The USDA extreme range in prices for dried albumen and yolk products in $ per lb. was released on June 16th 2023. Data posted by the USDA is incomplete but available values are depicted for the past week and in parentheses for the previous week and also past months to illustrate the trend in prices influenced by HPAI depopulation and subsequent repopulation:
|
Whole Egg
|
$5.50 to $8.75
(unchanged)
|
Average Feb. $11.08
March $11.75
April $11.28
May $ 9.15
|
|
Yolk
|
$4.50 to $7.30
(unchanged)
|
Average Feb. $11.94
March $11.23
April $ 9.85
May $ 7.67
|
|
Spray-dried white
|
No quotation, past week
|
Average Dec. $14.18
Jan. $14.18
Feb-May. No release
|
|
Blends
|
No quotation, past week
|
|
Frozen Egg Products
The USDA range in prices for frozen egg products in cents per lb. on June 16th compared to the previous week were generally little changed:-; Whole egg, unchanged; Whites, down 10%; Yolks, unchanged). This indicated a balance between available products and demand from the manufacturing and retail sectors: -
|
Whole Egg
|
$0.78 - $0.86
|
$0.72 - $0.84
|
|
White
|
$1.03 - $1.30
|
$1.00 - $1.60
|
|
Average for Yolks1
|
$2.03 - $2.10
|
$1.90 - $2.25
|
- extreme range
May averages (April): Whole. $1.02, ($2.03); Whites, $1.40, ($1.94); Yolks, $2.46, ($3.06).
Liquid Egg Products
The May 2023 averages for non-certified truckload quantities are tabulated (per lb.) with April 2023 values in parentheses are: -
Whole, $0.73, (145c); Whites, $1.35 ($1.63); Yolks, $2.25, ($2.90).
The USDA has not released a report on dried egg inventory since March 13th 2020 due to inability to obtain data from producers, and will not issue reports for the immediate future.
COMMENTS
There have been no reports of commercial egg-producing or broiler flocks affected by HPAI outbreaks since December 2022. Cases as expected during the first quarter of 2023 did not materialize. For reasons yet to be understood only a few outbreaks have been recorded among turkeys and backyard farms year-to-date. Incident cases were diagnosed in the Maritime Provinces followed by Quebec and Ontario in Canada during April but without extension along the four North American Flyways and no incident cases in commercial flocks in May. It is evident that some wild domestic birds continue to shed virus based on isolations of virus from wildlife and cases in backyard flocks. This situation requires more intensive monitoring including surveys of wild domestic birds and small mammals. Given the risks and consequences of infection it will be necessary to continue to maintain high levels of structural and operational biosecurity.
To date approximate losses in commercial flocks with confirmed HPAI and updates include:-
- 2,900,000 broilers on 18 farms in 7 states For 2023 to date losses are 450,000
- 330,000 broiler breeders on 11 farms in 6 states.
- 9,900,000 turkeys including a few breeder flocks on 231 farms in 7 states. For 2023 to date losses are approximately 250,000 with two incident cases in the Dakotas durin mid-May.
- 44,000,000 egg-production hens in total with 95 percent on 22 large complexes above 0.5 million in addition to 1,070,000 pullets with a total of 41 locations in 11 states. Pullet mortality does not include “at risk” replacements depleted on affected complexes with contiguous pullet rearing.
Collectively the USMCA nations have depopulated approximately 70 million birds in at least 900 flocks.
France and Holland have evaluated AI vaccines with success. Mexico and Egypt have introduced vaccination. An International conference on vaccination against HPAI took place in Paris on October 25th and 26th and recognized unjustified trade barriers as obstacles to adoption of vaccination.
Backyard flocks that are allowed outside access will continue to be at risk of infection in the U.S. These small clusters of birds in suburban areas are of minimal significance to the epidemiology of avian influenza as it affects the commercial industry. Backyard flocks serve as indicators of the presence of virus among free-living birds as evidenced by ongoing outbreaks in commercial poultry flocks across the U.S.
The level of biosecurity in commercial egg production complexes and broiler farms is appreciably higher than in 2015 when the U.S. experienced an epornitic along the Mississippi Flyway The response of state and federal authorities since this time has been rapid and effective both in diagnosing and depleting affected flocks possibly preventing lateral spread. To date, all floor-housed flocks that were infected were depopulated using foam. Euthanasia of egg production complexes involved various combinations of VSD+ applying heat or carbon dioxide or conventional kill-carts flushed with carbon dioxide.
The role of migratory waterfowl in introduction and subsequent dissemination of H5N1 HPAI virus is indicated by the close proximity of infected complexes and their counties with major waterways, lakes, wetlands or reservoirs during the spring and fall months of 2022. There is now limited subjective evidence of aerogenous transmission of HPAI over short distances with virus (possibly shed by wild endemic and migratory birds) becoming entrained in dust and introduced into ventilation inlets by powered ventilation systems.
A concern is represented by isolation of H5N5 avian influenza virus fron dead black backed gulls (Larus marinus) in Suffolk County, NY on March 30th;
Washington County, MN. On May 8th and from Barnstable and Plymouth Counties MA. On May 26th. Surveillance continues as this H5N5 virus has a Eurasian genome.
It would have been of practical and financial benefit for APHIS epidemiologists to have reported on their findings from the questionnaires completed following outbreaks on commercial farms during the first quarter of 2022. Given the costs to the private and public sectors and to consumers priority should have been extended to the first seven large egg complexes affected. Case-comparison studies against representative unaffected complexes should have been performed using specific and relevent questionnaires. This would have provided advice to producers on risk factors.
A preliminary opinion with guidance during mid-April 2022 concentrating on large egg complexes was not an unrealistic request. This is especially the case since large egg complexes in Northwest Ohio and in Colorado were infected during September, in Iowa in October and again in November and in Oregon and South Dakota during early December 2022. This suggested ongoing exposure from wild domestic birds and possibly mammals in addition to migratory waterfowl as evidenced by the increasing incidence in backyard flocks that effectively serve as sentinels. An interim report was released during the first week of March 2023, inexplicably backdated to July 2022. This document, lacking either conclusions or recommendations was critiqued in a special edition of EGG-NEWS on March 8th.
 |
The USDA-APHIS presented a webinar to review the results of epidemiologic studies on May 31st. The data presented failed to provide any practical or applicable recommendations to reduce infection based on limited numbers of flocks incorporated into a case-control study applying a dated and presumably inappropriate questionnaire administered by telephone survey.