REVIEW OF MAY 2023 EGG PRODUCTION COSTS AND STATISTICS.
MAY HIGHLIGHTS
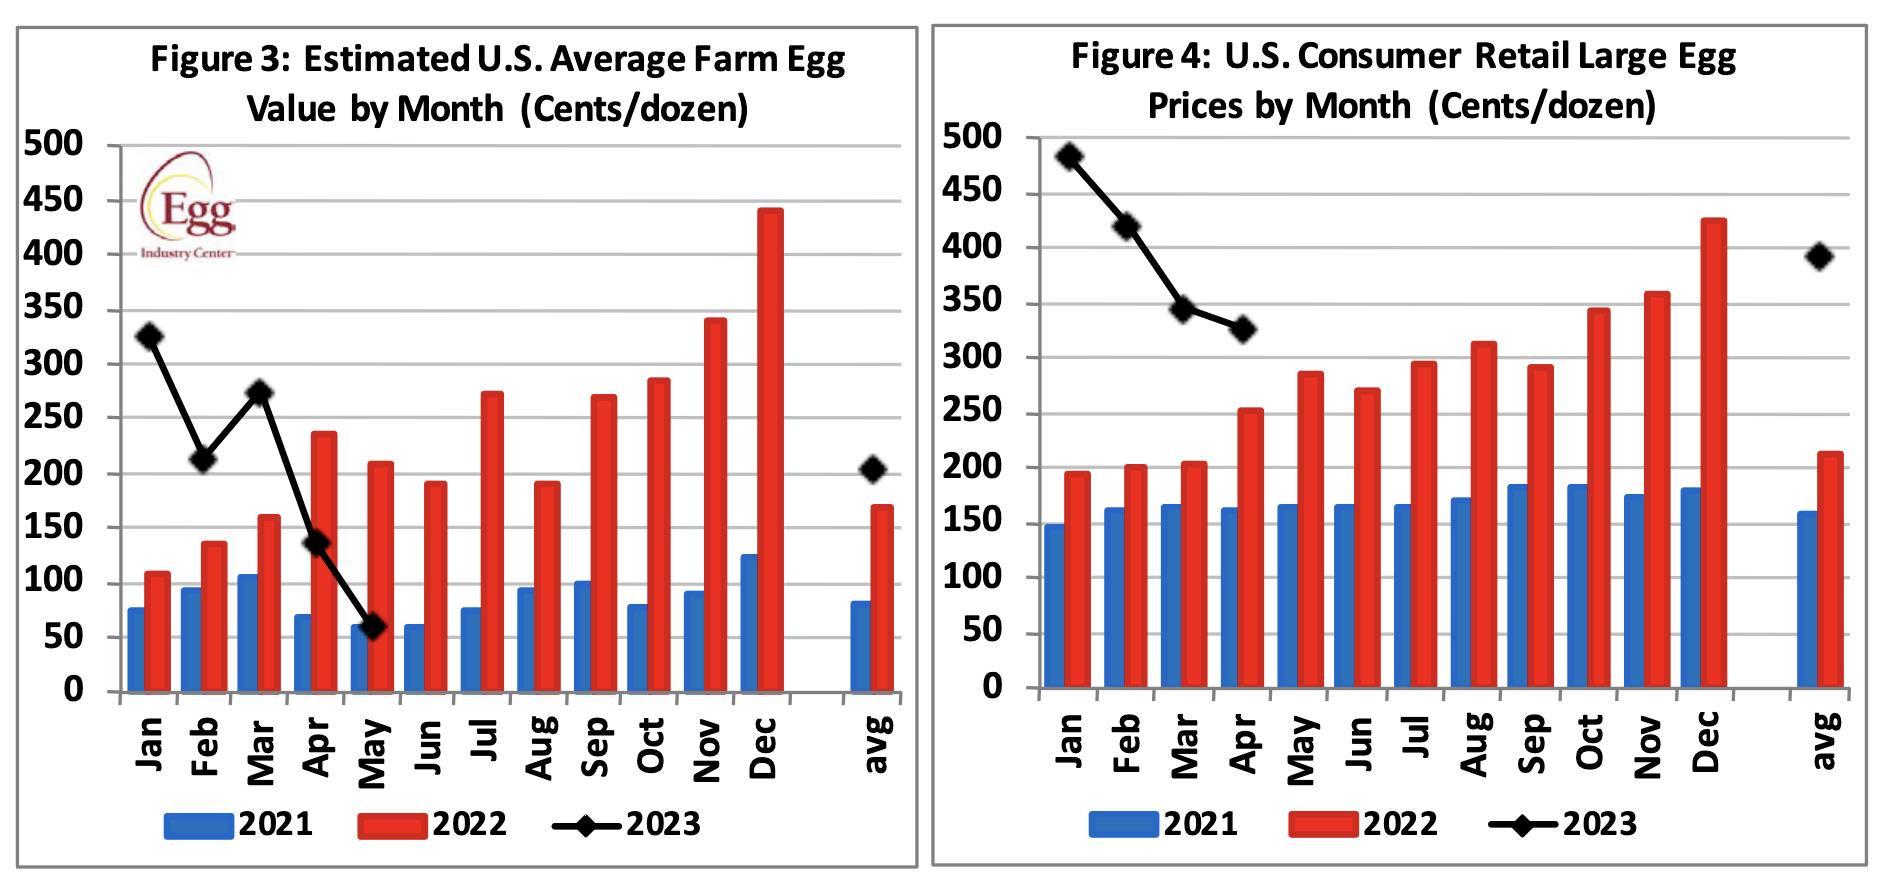
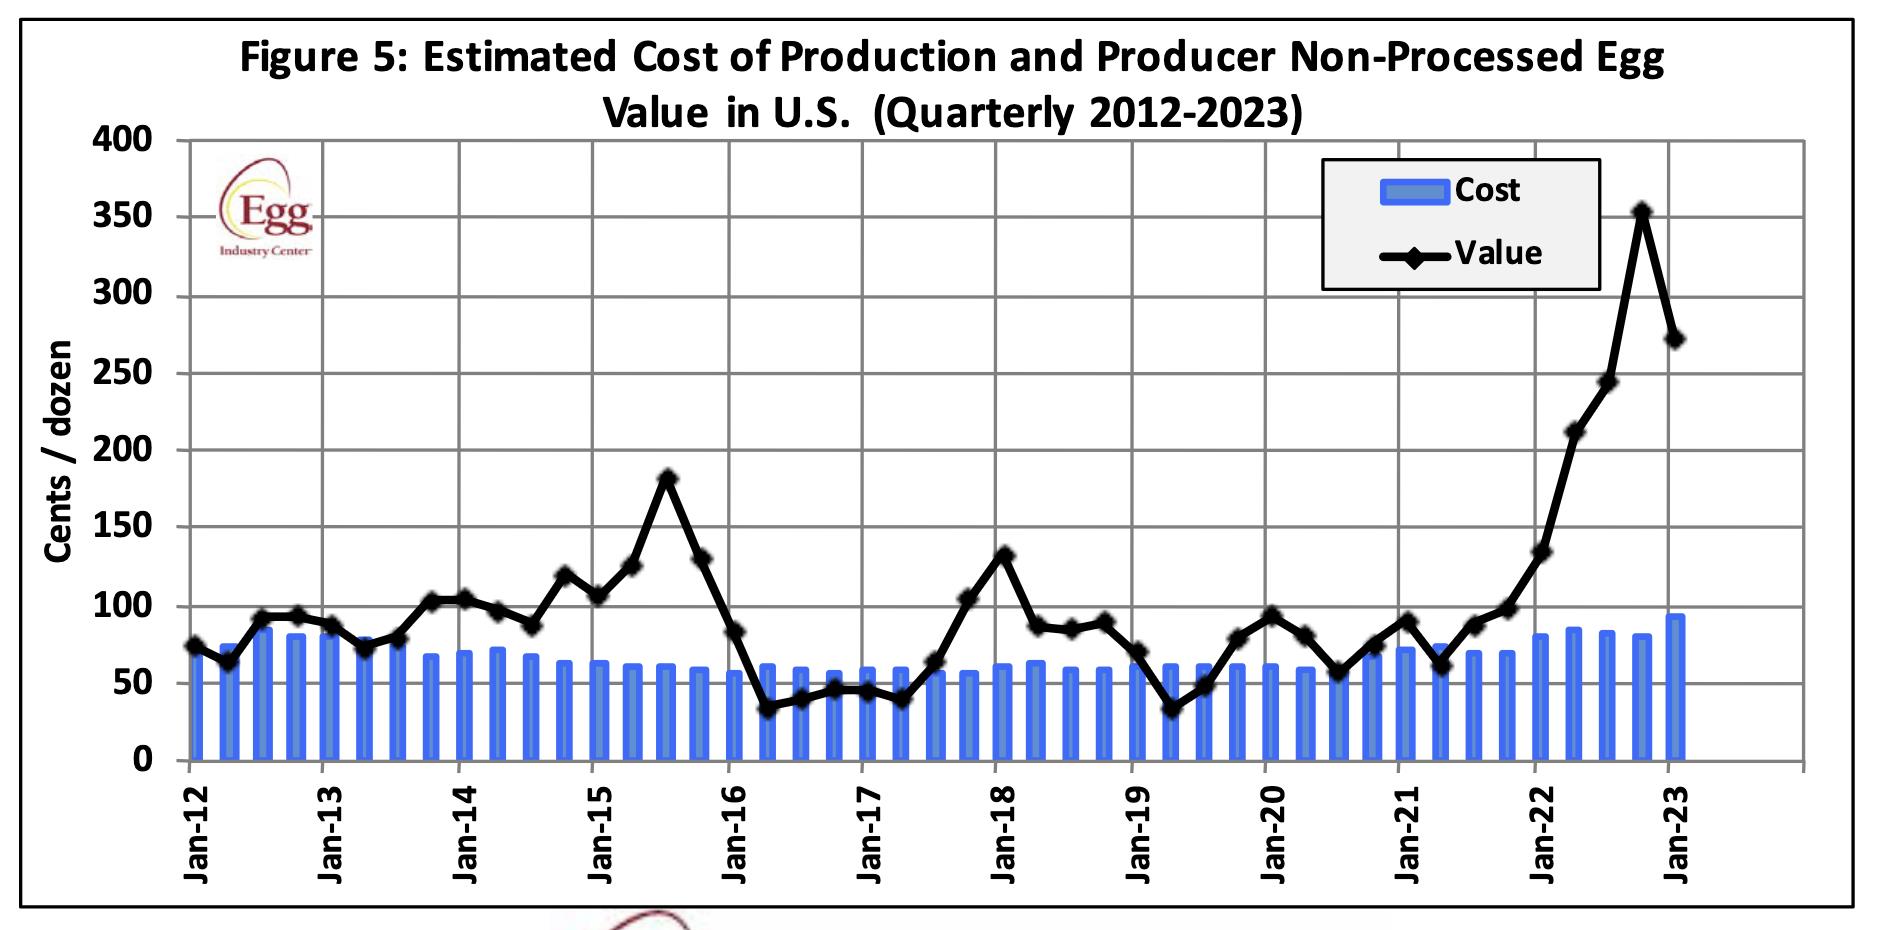
- May 2023 USDA ex-farm blended USDA nest-run benchmark price was 60.3 cents per dozen, down 56.3 percent from the April 2023 value of 138.1 cents per dozen. For comparison average USDA benchmark price over 2022 was 236.1 cents per dozen with a range of 191.1 cents per dozen in June to a high of 439.1 cents in December. Stock levels and prices prior to the onset of flock depletion due to HPAI indicated a relative seasonal balance between supply and demand. Prevailing wholesale prices will be largely dependent on future consumer demand in an inflationary environment. Other considerations include diversion to shell sales from the egg-breaking sector. Fluctuation in wholesale price is attributed to the amplification of changes due to the price discovery system in use. A significant decline from 1st Quarter 2023 values is anticipated into mid- 2023.
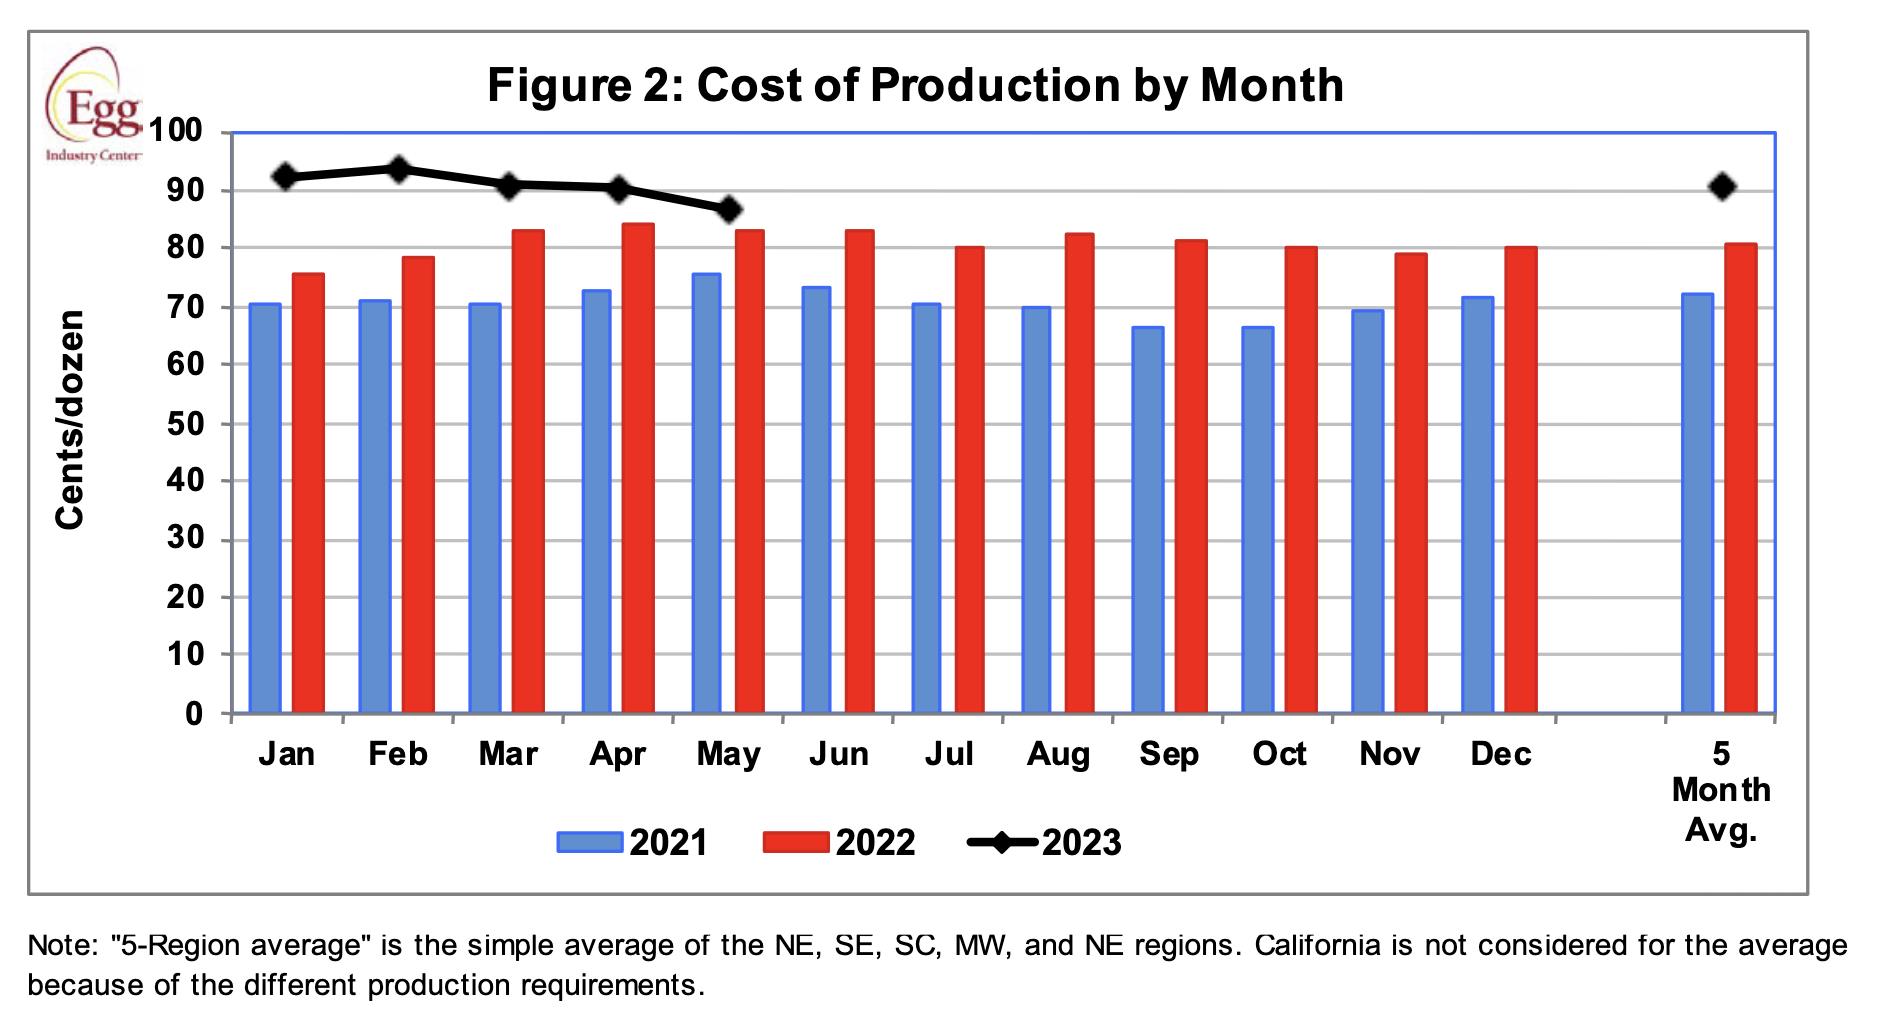
- May 2023 USDA average nest-run production cost, applying updated inputs was down 3.4 cents per dozen (3.8 percent) to 86.9 cents per dozen compared to the April 2023 updated value of 90.3 cents per dozen, mainly attributable to a 6.2 percent lower average feed cost per dozen.
- May 2023 USDA benchmark nest-run margin attained a negative value of (26.6) cents per dozen compared to an updated positive margin of 47.8 cents per dozen for April 2023. Average nest-run monthly margin over 2022 was 155 cents per dozen.
- The April 2023 national flock in production (over 30,000 hens/farm) was up 0.6 percent or 1.9 million hens (rounded) to 299.1 from the March 2023 value of 296.6 million. Approximately 3.5 million hens returned to production from molt in April together with projected maturation of 22.0 million pullets, with this number offset by depletion of spent flocks. From February through mid-December 2022, approximately 44 million hens were depopulated to control HPAI reducing the producing flock by an approximate ongoing weekly average of 20 million hens during 2022.
- April 2023 pullet chick hatch was down 21.3 percent or 6.3 million from February 2023 to 23.2 million.
- April 2023 exports of shell eggs and products combined were down 26.6 percent from March 2023 to 426,700 case equivalents representing the theoretical production of 5.9 million hens.
TABLES SHOWING KEY PARAMETERS FOR MAY 2023.
Summary tables for the latest USDA May 2023 prices and flock statistics made available by the EIC on June 12th 2023 are arranged, summarized, tabulated and compared with values from the previous May 8th 2023 posting reflecting April 2023 costs and production data.
COSTS & REVENUE
|
Parameter
|
MAY 2023
|
APRIL 2023
|
|
5-Region Cost of Production ex farm (1st Cycle)1
|
86.9 c/doz
|
90.3 c/doz
|
|
Low
|
83.5c/doz (MW)
|
86.6 c/doz (MW)
|
|
High
|
94.7 c/doz (N.West)
|
98.8c/doz (N.West)
|
Components of USDA 6-Region 1stCycle nest-run Cost of Production updated by the EIC in May 2023 following an industry survey:-
Note: 1. Rounded to decimal of a cent
|
|
MAY 2023
|
APRIL 2023
|
|
Feed
|
47.2 c/doz
|
50.3c/doz
|
|
Pullet depreciation
|
12.8 c/doz
|
13.2 c/doz
|
|
Labor (estimate) +
|
|
|
|
Housing (estimate) +
|
26.9c/doz1
|
26.8c/doz
|
|
Miscellaneous and +other*
|
|
|
* Adjusted May 2023
Ex Farm Margin (rounded to nearest cent) according to USDA values reflecting MAY 2023:-
60.3 cents per dozen1- 86.9 cents per dozen = (26.6) cents per dozen (April 2023 comparison: 138.1 cents per dozen – 90.3 cents per dozen = 47.8 cents per dozen.)
Note 1: USDA Blended egg price
|
|
|
MAY 2023
|
APRIL 2023
|
|
USDA
|
Ex-farm Price (Large, White)
|
60.3 c/doz (May)
|
139.1c/doz (April)
|
|
|
Cage-free to packing plant1
|
97.0 c/doz (May)
|
107.0 c/doz (April)
|
|
|
Warehouse/Dist. Center
|
94.0 c/doz (May)
|
216.0 c/doz (April)
|
|
|
Store delivered (estimate)
|
99.0 c/doz (May)
|
221.0 c/doz (April)
|
|
|
Dept. Commerce Retail
|
327.0 c/doz (April)
|
344.6 c/doz (March)
|
1. Negotiated price nest run loose
MONTH MAY 2023 APRIL 2023
U.S. Average Feed Cost per ton $292.16 $311.51
Low Cost Midwest $273.33 $290.51
High Cost Northwest $336.11 $358.48
Differential $ 62.78 $ 67.97
Pullet Cost*
(19 Weeks) $5.04 MAY 2023 $5.19 APRIL 2023
(16 weeks) $4.40 MAY 2023 $4.52 APRIL 2023
* Values adjusted by EIC in May 2023
VOLUMES OF PRODUCTION
|
PARAMETER
|
MAY 2023
|
APRIL 2023
|
|
Table-egg strain eggs in incubators
|
47.4 million (May)
|
55.5 million (April)
|
|
Pullet chicks hatched
|
23.2 million (April)
|
29.5 million (March)
|
|
Pullets to be housed 5 months after hatch
|
20.9 million (Sept.)
|
26.6 million (Aug.)
|
|
EIC 2023 December 1st Flock Projection (June 2023)
|
332.0 million
|
332.2 million
|
|
National Flock in farms over 30,000
|
299.1* million (April)
|
296.6 million (March)
|
|
National egg-producing flock
|
316.1* million (April)
|
313.6 million (March)
|
|
Cage-free flock excluding organic
|
103.4 million (May)
|
103.2 million (April)
|
|
Proportion of flocks in molt or post-molt
|
13.4% (May)
|
12.5% (April)
|
|
Total of hens in National flock, 1st cycle (estimate)
|
273.7* million (April)
|
274.4 million (March)
|
* USDA Revision
|
Total U.S. Eggs produced (billion)
|
7.71 APRIL
|
7.88 MARCH
|
|
Total Cage-Free hens in production
|
121.6 million (May)
15.0% Organic
|
121.4 million (April)
15.0% Organic
|
|
“Top-5” States hen population (USDA)1
|
157.2* million (April)
|
150.7 million (March)
|
Notes 1. Texas excluded to maintain confidentiality
* USDA Revision
PROPORTION OF U.S. TOTAL HENS BY STATE, 20231
Based on a nominal denominator of 300 million hens in flocks over 30,000 covering 95.0 percent of the U.S complement.
USDA has amended inclusion of specific states in regions and eliminated Texas data to protect confidentiality of Company flock
Sizes
|
STATE
|
APRIL
2023
|
MARCH
2023
|
|
|
Iowa
|
14.1%
|
14.7%
|
|
|
Indiana
|
12.1%
|
12.2%
|
|
|
Ohio
|
12.4%
|
12.4%
|
|
|
Pennsylvania
|
7.5%
|
7.7%
|
|
|
Texas (estimate)
|
7.1% ?
|
7.0%
|
|
|
California
|
3.7%
|
3.7%
|
|
- Values rounded to 0.1%
Rate of Lay, weighted hen-week (USDA) 81.2% MAY 2023. 81.3% APRIL 2023
Revised per capita egg consumption 2019:- 293.4 (up 5.6 eggs from 2018)
Revised per capita egg consumption 2020:- 285.6 (down 7.8 eggs from 2019)*
Revised per capita egg consumption 2021:- 282.5 (down 3.1 eggs from 2020)*
Revised per capita egg consumption 2022:- 279.0 (down 3.5 eggs from 2021 due to HPAI)
Projected per capita egg consumption 2023:- 285.1 (up 6.1 eggs from 2022)
Forecast per capita egg consumption 2024 293.2 (up 8.1 eggs from 2023 assuming no reoccurrence of HPAI)
*Revised, using data from USDA Livestock, Dairy and Poultry Outlook May 12th 2023 taking into account demand from the food service sector and including the effect of HPAI depopulation.
Egg Inventories at beginning of MAY 2023:
Shell Eggs: 1.91 million cases up 13.0 percent from April 2023.
Frozen Egg Products: 643,203 case equivalents up 2.4 percent from April 2023
Dried Egg Products: Not disclosed since March 2020 following market disruption due to COVID. Assume moderate level of inventory
Eggs broken under FSIS inspection (million cases)
APRIL 2023, 6.27 MARCH 2023, 6.26
Cumulative eggs broken under FSIS inspection 2022 (million cases) 79.3 JAN. to DEC.
Cumulative 2022: number of cases produced (million) 257.3 JAN. to DEC.
Cumulative 2022: proportion of total eggs broken 30.8% (28.9% 2021)
Cumulative 2023: number of cases produced (million) 84.4.0 JAN. – APRIL.
Cumulative 2023: proportion of total eggs broken 29.7%
EXPORTS APRIL 2023: (Expressed as shell-equivalent cases of 360 eggs).
|
Parameter
|
Quantity Exported
|
|
Exports:
|
2023
|
|
Shell Eggs (thousand cases)
|
MARCH 282 APRIL 215
|
|
Products (thousand case equivalents)
|
MARCH 299 APRIL 212
|
|
TOTAL (thousand case equivalents)*
|
MARCH 581 APRIL 427
|
*Representing 2.0 percent of National production in APRIL 2023.
COMMENTARY ON MAY 2023 COSTS AND STATISTICS
COST AND REVENUE DATA FOR MAY 2023
The USDA reports data for five regions, respectively comprising the Northeast, South East (Mid-Atlantic), South Central, Midwest, and Northwest (NW and California combined in some tables).
From March 2019 onward some state data was withheld to maintain confidentiality where a company predominates in a specific state or region. From March 2021 California costs were inexplicably excluded, representing an unjustified concealment of data. The three Pacific Coast states could be combined to maintain confidentiality while providing representative U.S. data. Costs include fixed components (interest, depreciation and overhead) and variable components (feed, pullet depreciation, labor) recalculated in May 2023 by the EIC based on surveys
- The USDA ex farm benchmark blended egg price in May 2023 was 56.3 percent lower or 77.8 cents per dozen from April 2023 to 60.3 cents per dozen. This contributed to a negative margin of (26.6) cents per dozen based on ‘nest-run’ eggs (ungraded as delivered from the laying house) in May 2023, compared to a positive margin of 47.8 cents per dozen in April 2023. The May 2023 USDA benchmark price of 60.3 cents per dozen should be compared to 59.5 cents per dozen for the corresponding month in 2021 and 208.9 cents per dozen in April 2022 impacted by HPAI. The relatively high values from the second through fourth quarters of 2022 compared to corresponding periods for the two previous years were due to depletion of hens following the emergence of HPAI coupled with a rise in demand following relaxation of COVID restrictions and the amplification of price rises due to the benchmark costing system.
- During May 2023, the feed component of production cost averaged 47.2 cents per dozen, down 6.2 percent or 3.1 cents per dozen from April 2023. During 2022 average feed cost was 50.1 cents per dozen compared to 42.5 cents per dozen in 2021 and 31.7 cents per dozen in 2020.
- Combining data from the USDA and the EIC, producers recorded a negative margin of (26.6) cents per dozen at farm-level for generic-egg flocks during May 2023. This compares with a positive margin of 47.8 cents per dozen in April 2023. During 2022 cumulative algebraic margin attained 1,887 cents per dozen. For 2021 the cumulative average algebraic margin was 91.0 cents per dozen; for 2020, 16.0 cents; for 2019, (2.8) cents and for 2018, 35.3 cents per dozen, against USDA benchmark ‘nest run’ values.
- The simple average price of feed in May 2023 over 5-regions was $292.16 per ton, lower by $19.35 per ton or 6.2 percent compared to April 2023. Southwest data is no longer disclosed to avoid compromising a company that predominates in Texas. The highest cost among five regions was the Northwest at $336.11 per ton, down 6.2 percent from April 2023. This may be compared to the lowest-cost region, the Midwest at $273.33 per ton, down 5.9 from the previous month. The average cost for feed includes ingredients plus milling and delivery at a nominal $10 per ton.
- The benchmark price of corn was $238.72 per ton in May 2023, down $17.06 per ton or 6.7 percent from the average April 2023 price, taking into account the difference in basis paid by producers. The differential in corn price between the Midwest and the Northwest in May 2023 was $66.67 per ton. A 7.1 percent decrease of $33.86 per ton in the price of soybean meal to $443.39 per ton in May 2023 contributed to a lower cost of feed. During May 2023 there was a differential of $62.78 per ton in feed price between the Midwest and the Northwest compared to a difference of $67.58 per ton in April 2023 corresponding to 11.8 cents per dozen. The industry has experienced sharp increases in the cost of phosphate additives, fat and vitamins since March 2022.
- Feed price will continue to be a major factor driving production cost and hence margin. WASDE #637 (in this edition) released on June 9th confirmed the volumes for the 2023 corn and soybean harvests, ingredient use, exports and ending stocks for the two major feed ingredients. Unknown factors influencing feed cost during the third quarter of 2023 will include the consequences of the invasion of Ukraine with inevitable disruption in production and especially shipping from the region. This influence coupled with the projected large harvests in Brazil, notwithstanding drought, and demand by China will determine prevailing prices in international trade. The availability and hence prices of ingredients will also be influenced by weather conditions following the transition from a La Nina, in the second quarter of 2023, to become an El Nino event; drought affecting early-planted corn in the Midwest; export volume from the U.S. and especially to China; diversion of corn to ethanol and soy oil to biodiesel; the remaining economic and logistic effects of COVID restrictions and inflation. There is obviously lower demand for ethanol with production projected by the U.S. Energy Information Administration at 970,000 barrels per day with one-million barrels per day produced during the first half of 2023. Substantial exports of soybeans to China, during market year 2022/2023 is increasing domestic price and hence cost of egg production. Each $10 per ton difference in feed cost represents approximately 1.70 cents per dozen. A change of $1 per ton (2.8 cents per bushel) in the price of corn is reflected in a 0.11 cent per dozen change in production cost. A $10 per ton change in the price of soybean meal affects production cost by 0.35 cent per dozen.
- The EIC calculated the 5-Region adjusted total nest-run production cost in April to be 86.9 cents per dozen, 3.4 cents per dozen equivalent to 3.8 percent lower than in April 2023. Production costs during May 2023 ranged from 83.5 cents per dozen in the Midwest up to 94.7 cents per dozen in the Northwest, higher than the Midwest region by 11.2 cents per dozen. During 2022 the average monthly cost of production was 81.0 cents per dozen.
Deletion of California data is considered a substantial deficiency of the EIC Report.
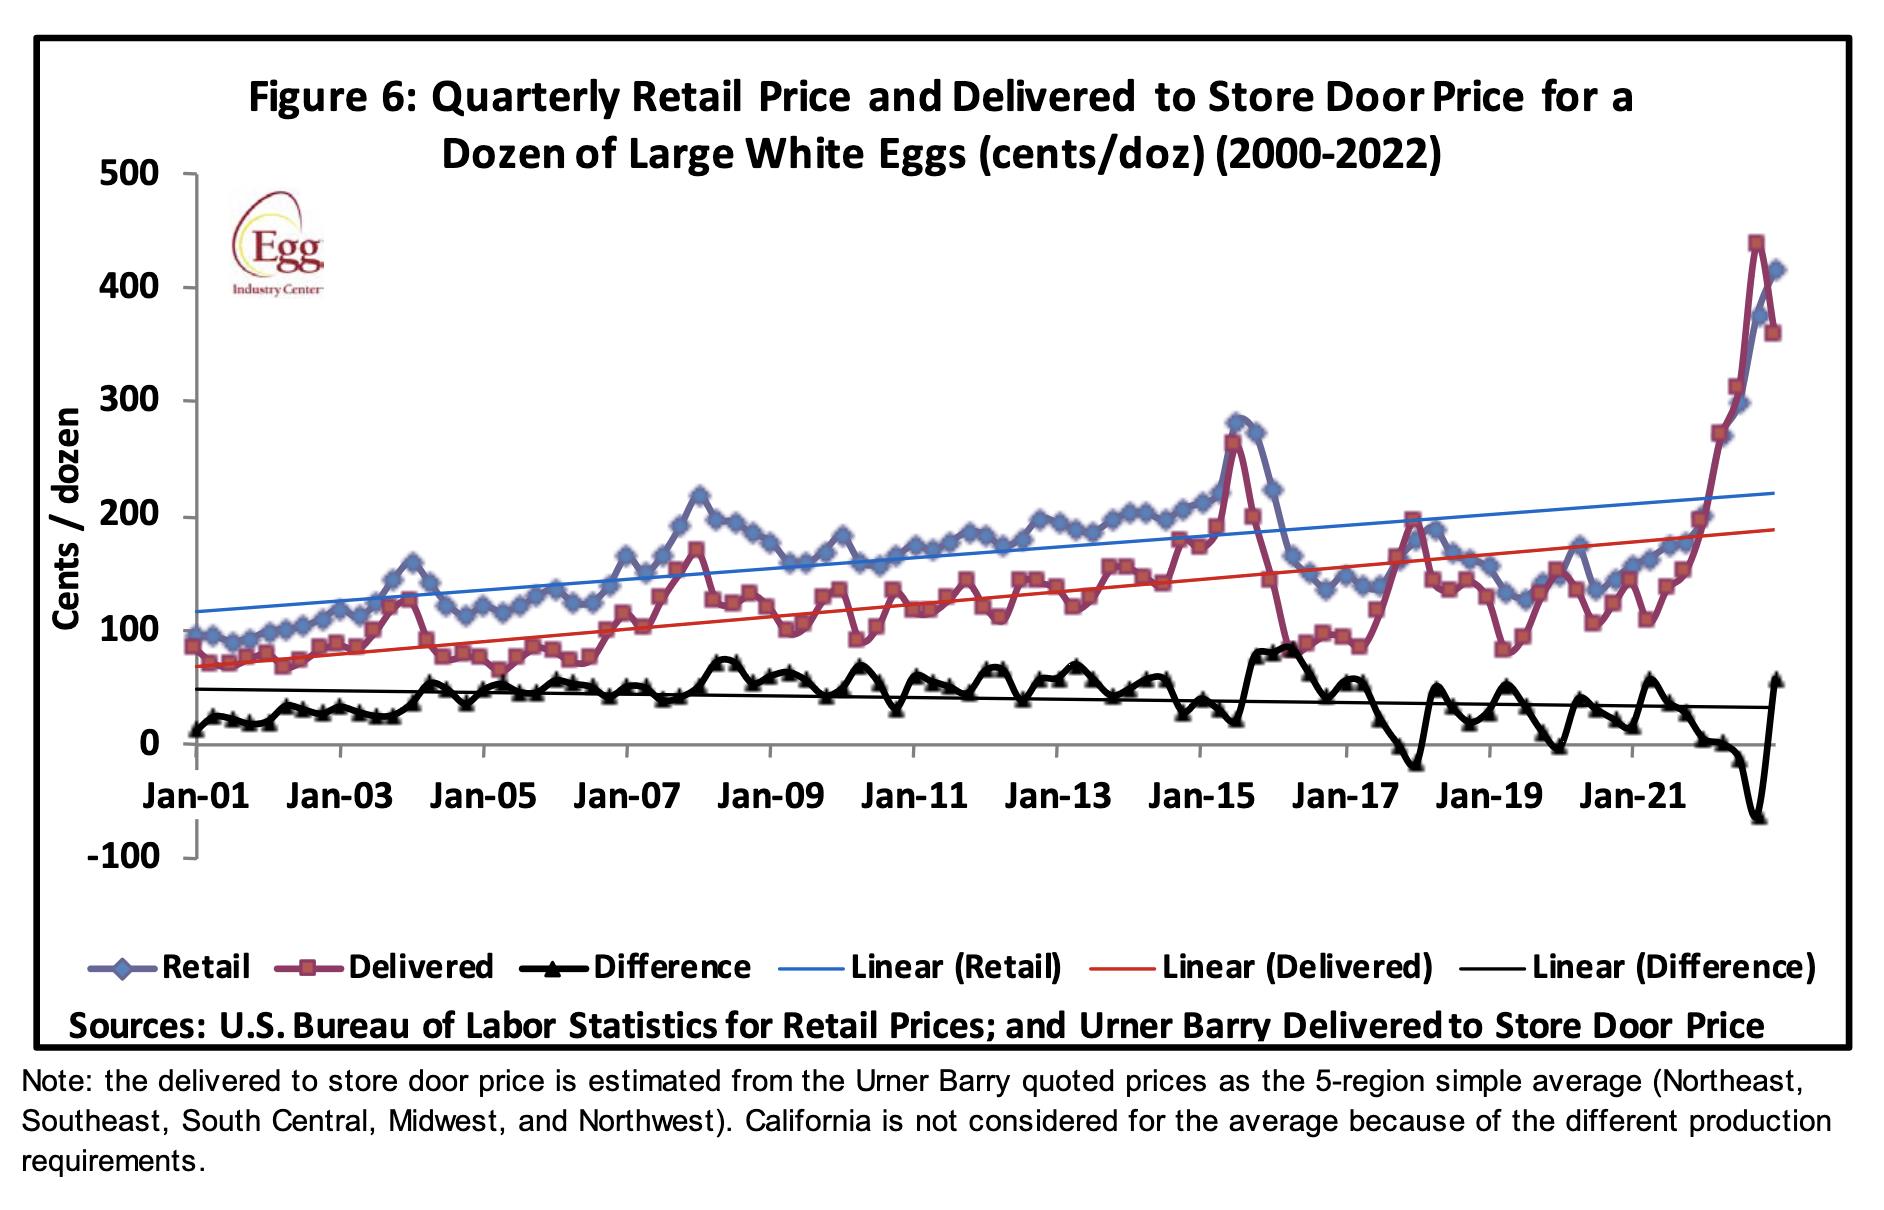
- Retail egg prices as determined by the Department of Commerce in April 2023 averaged 327.0 cents per dozen, down 17.6 cents per dozen, compared to March 2023 at 344.6 cents per dozen. During April 2021 and 2022 retail prices were respectively 162.0 and 252.0 cents per dozen. Through 2017 and 2021 average retail prices did not decline in proportion to ex-farm prices, allowing higher margins at retail, thereby depressing demand. Retailers have recently demonstrated some restraint in pricing possibly due to competition from deep discounters and club stores, despite sustained demand.
- April 2023 average retail markup on generic white Large was 47.9 percent based on a delivered-to-store price of $2.21 per dozen and USDA Retail of $3.27 per dozen.
PRODUCTION DATA FOR MAY 2023
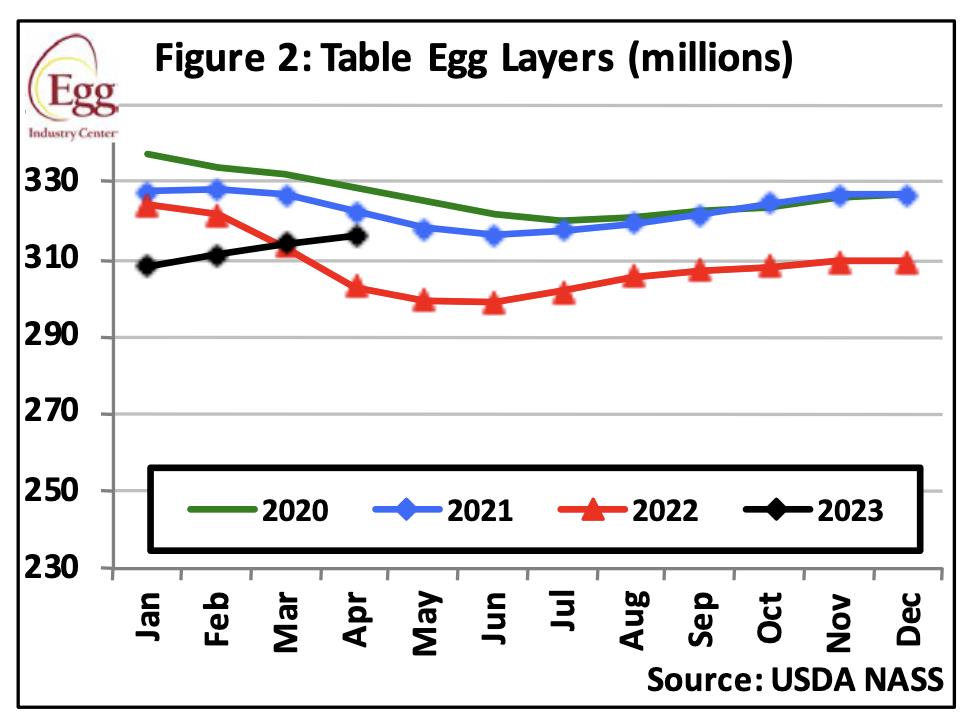
- According to USDA, the estimated average complement of U.S. hens in flocks over 30,000 during April 2023 amounted to 299.1 million, reflecting a net increase in flock size by 1.9 million hens during the month. Routine depletion and also depopulation due to HPAI during 2022 was offset by pullet replacements and retained flocks. The average total U.S. flock including hens in molt on all farms counted by the USDA amounted to 316.1 million in April 2023. The average end-of-year flock sizes over the past seven years respectively were, 2014, (311 million); 2015, (291 million post-HPAI losses); 2016, (319 million); 2017, (329.6 million); 2018, (341.6 million); 2019, (341.6 million) and 2020, (325.5 million). The December 1st 2023 flock was projected to be 332.0 in June 2023 applying the EIC model. Flock size during 2022 was depressed by two waves of depopulation due to HPAI amounting to 44 million hens through mid-December 2022. With replacements, molting and delayed depopulation it is estimated that the national flock now comprises 10 to 12 million fewer hens each week than before the advent of HPAI. In the absence of a vaccine only effective biosecurity will protect flocks going forward.
- Pullet chick hatch attained 23.2 million in April 2023, down 6.3 million from March 2023. Seasonal prices were considerably higher than in preceding years into 2023, resulting in demand for chicks for expansion in addition to necessary replacement of depleted pullets and hens. It is understood that production of additional pullet chicks is unlikely given forward planning by breeder-hatcheries and full utilization of facilities.
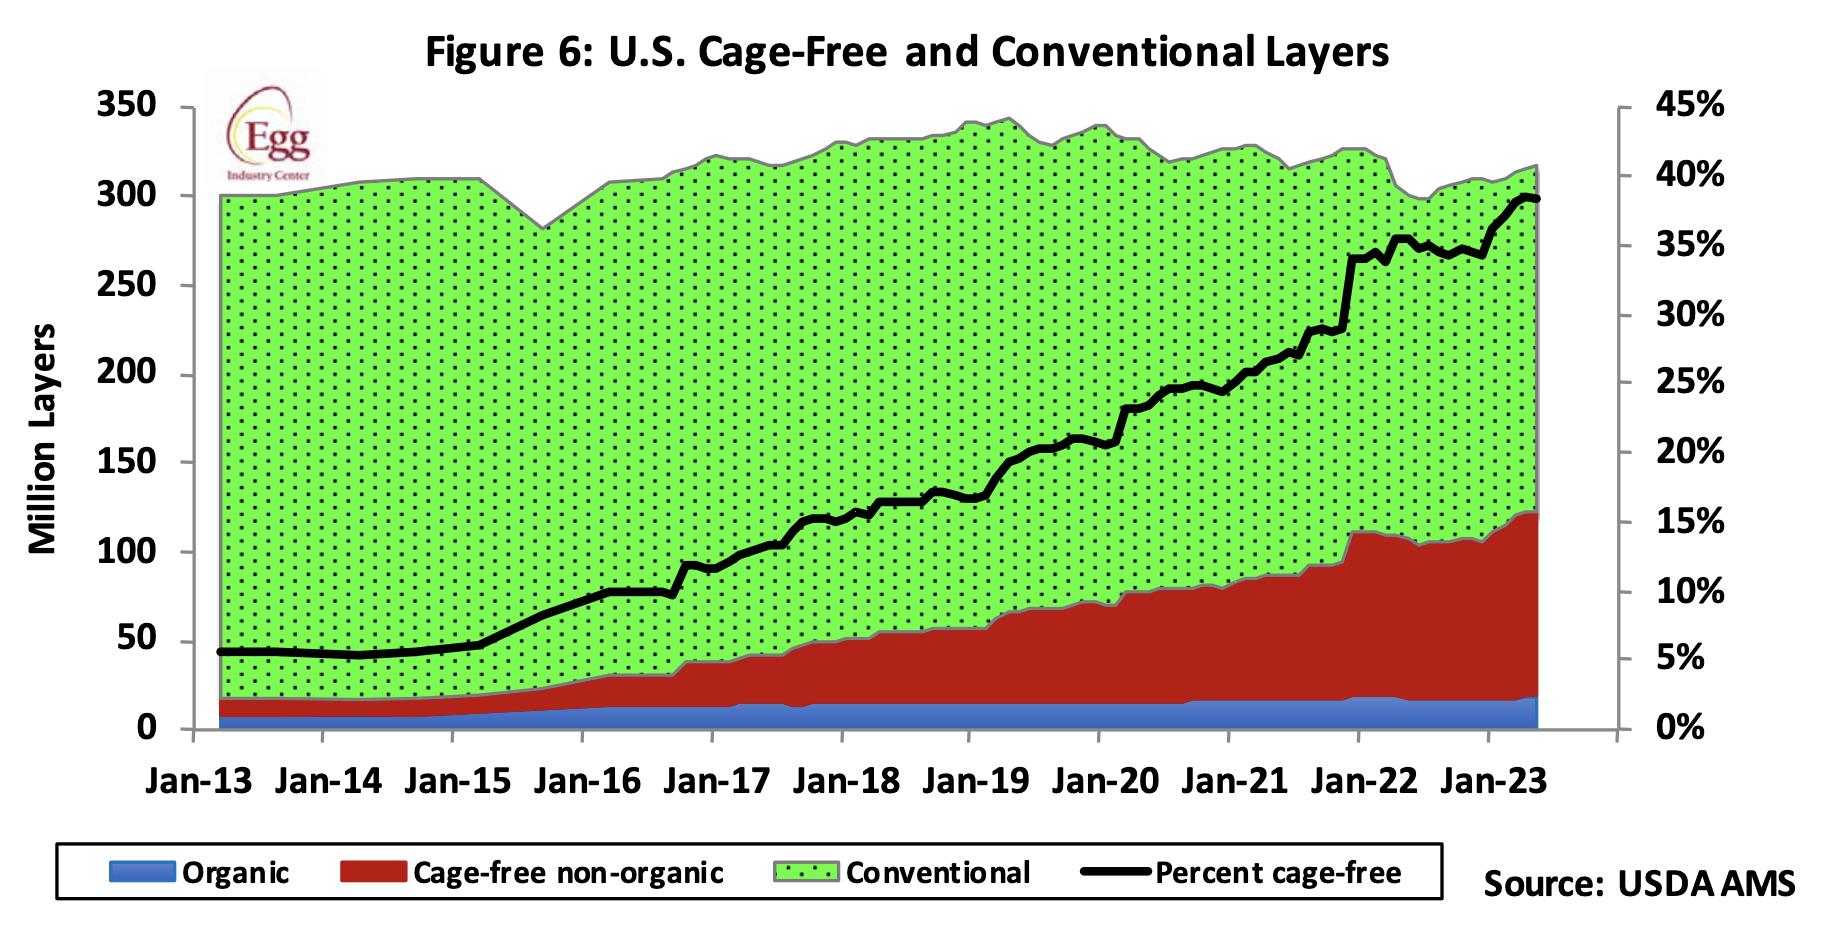
- The total in-molt and post-molt population of hens in the 5-Regions monitored by the USDA attained 13.4 percent of the national flock in May 2023, unchanged from the previous month. Annual averages for molt and post-molt combined were 14.4 percent in 2021, 13.5 percent for 2020, 15.2 percent for 2019 and 17.4 percent for 2018. The historical high value of 23.8 percent in 2016 was due to the loss of hens during the 2015 HPAI epornitic. This situation will not be revisited in 2023.
- During the first quarter of 2023 the average monthly transfer of pullets to laying houses was 23.5 million to be followed by 20.8 million in the second quarter and 24.5 million in the third quarter.
- The projected hatchery supply flock (parent generation) peaked during 2022 at 3.1 million hens in June. The previous high parent-flock of 3.1 million hens in production was in June 2015, coinciding with the end of the HPAI epornitic. Parent hens then declined to a low of 2.5 million during the fourth quarter of 2016. Parent flocks attained a monthly average of 2.9 million during the third quarter and 2.8 million for the fourth quarter of 2022. During 2023 the flock size for parent hens will average 2.47 million for the fourth quarter. The size of the parent flock is unlikely to be revised based on pullet chick orders influenced by the demand to replace depopulated hens and in response to higher producer margins.
- Average hen-week production of 81.2 percent in May 2023 compared to a revised value of 81.4 percent in April 2023 reflects a similar proportion of older hens in the national flock with many first-cycle hens and early second-cycle hens in production. Average rate of lay in 2021 was 82.0 percent, with 80.9 percent in 2020 and compared to 79.2 percent during 2019. The average rate of lay during any period is a function of the proportion of pullets placed, the rate of depletion of flocks and retention of molted hens for a second cycle. Average flock production declines as the weighted flock age increases or conversely will rise due to early depletion thereby increasing the proportion of young hens in their first cycle.
- The May 25th edition of the USDA Poultry Slaughter Report documented 2.9 million light spent-hens processed under FSIS inspection during April 2023, 5.7 percent less than during the previous month of March 2023 and 33.3 percent more than in March 2022. These differences are inconsequential in comparison to the depletion of 15 million hens per month with the bulk either rendered or consigned to landfills. Provided housing space is available, prevailing high prices will result in retention of hens with fewer routine or previously scheduled flock depletions.
EXPORT DATA FOR APRIL 2023.
- Monthly export data can be accessed in the relevant report posted in this edition and thereafter through mid-July under the STATISTICS Tab.
- According to USDA-FAS data, 215,000 cases of shell eggs were exported in April 2023, representing 1.0 percent of total production. This was a 32.8 percent decrease over March 2023. Exports reflected demand from Canada and some Central American and Caribbean nations.
- Exports of egg products in April 2023 attained 212,000 case-equivalents down 29.0 percent from the previous month, representing 1.0 percent of U.S. output.
- Collectively, exports of shell eggs and products in April 2023 comprised the output from approximately 5.9 million hens in production during the month, attaining 426,700 case-equivalents, down 26.6 percent from March 2023 and 71.6 percent of combined exports during the pre-HPAI first quarter of 2022 averaging 596,300 case equivalents per month.
- Maintaining export volume is attributed to cooperation between the AEB and USAPEEC, in existing, new and potential markets. Specific attention is directed to nations with the potential to import U.S. product based on landed price against competition. Exports of both egg-products and shell eggs in April 2023 corresponded to 2.0 percent of a nominal national flock of approximately 310 million producing hens, (before HPAI depletions) on commercial farms holding more than 30,000 hens.
- There is no scientifically justifiable reason why any nation should embargo pasteurized egg products from an approved plant, based on a diagnoses of avian influenza or velogenic Newcastle disease in a specific state or country.