USDA Weekly Egg Price and Inventory Report, April 5th 2023.
Market Overview
- The average wholesale unit revenue values for Midwest Extra-large and Large sizes were lower this week by 9.5 percent on average, representing a reversal of the upward move for five weeks after seven previous consecutive weeks of decline. Mediums were down 10.9 percent with a higher price differential from Large, indicating restoration in the balance between supply and demand in this size. This past week shell egg inventory was down 1.8 percent inconsistent with increased seasonal demand and presumably lower shelf prices. Retail price is increasing but will be moderated by restoration of the national flock with a lagging rate. Over the coming two weeks the volume of retail purchases will be influenced by seasonal pre-Easter demand. If chains reduce margins consistent with prevailing wholesale prices, higher demand can be anticipated. Eggs are still competitive in price against the comparable costs for other protein foods. Availability and hence prices have been influenced by depletion of close to 44 million hens in 22 large complexes in eleven states extending from the last week in February through mid-December 2022 with the producing flock down on average by 20 million hens during 2022 and continuing into 2023 compared with the pre-HPAI complement.
- Total industry inventory was down by 1.2 percent overall this past week to 1.69 million cases with a concurrent 1.6 percent increase in breaking stock attributed to less diversion but with higher pre-Easter demand from food service and industry. This is indicated by higher prices for egg products. Wholesale unit prices during early 2023 although on a downward trajectory during January and early February have trended upwards but with a lower trend suggesting a market high last week. Wholesale prices contrast favorably with 2020 and 2021 characterized by low ex-plant unit revenue.
- It is now apparent that the inventory held by chains and other significant distributors may be more important over the short term in establishing wholesale price than the USDA regional inventory figures published weekly. This is probably the reason for the two consecutive weekly increases in stock with only a small change in the size of the national flock and with rising wholesale prices.
- Due to the depletion of flocks as a result of HPAI, relatively high unit revenue compared to pre-HPAI will now be a reality into April 2023. Sporadic outbreaks of HPAI are likely given the seasonal Spring migration of waterfowl. The number and extent of outbreaks cannot be assessed until more information is available concerning the molecular and field epidemiology relating to cases. The USDA has yet to identify modes of transmission for the 2022 epornitic including airborne spread. There have been no case-control studies released on possible deficiencies in biosecurity on affected complexes that presumably demonstrated specific risk factors. APHIS has been remiss in evaluating available data and providing timely practical guidance on prevention as evidenced by releasing a backdated report during the first week of March that was devoid of recommendations to prevent HPAI infection in flocks.
- The current relationship between producers and chain buyers based on a single price discovery system constitutes an impediment to a free market. The benchmark price amplifies both downward and upward swings as evidenced over the past six months. The benchmark possibly functions to the detriment of the industry over the long term. A CME quotation based on Midwest Large, reflecting demand relative to supply would be more equitable. If feed cost is determined by CME ingredient prices then generic shell eggs should be subject to a Midwest Large quotation.
- According to the USDA the U.S. flock in production was down 0.5 percent or 1.5 million hens to 298.8 million hens during the week ending April 5th. The flock in production includes about 3.0 million molted hens that resumed lay during the past week plus 4.0 million pullets attaining production.
- The ex-farm price for breaking stock was down 17.2 percent this past week to 240 cents per dozen.Checks delivered to Midwest plants were down 14.9 percent to 239 cents per dozen. Prices for breaking stock will remain high over the period of recovery from HPAI until replacement flocks reach maturity.
The Week in Review
Prices
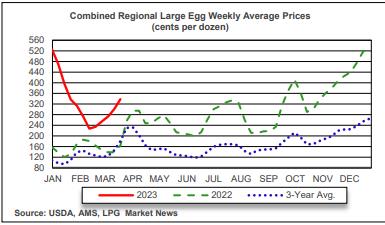
According to the USDA Egg Market News Reports released on April 3rd the Midwest wholesale price (rounded to one cent) for Extra-large was down 9.5 percent to $3.07 per dozen. Large size was down 9.5 percent to $3.05 per dozen; the Medium price was down 10.9 percent to $2.62 per dozen as delivered to DCs. Prices should be compared to the USDA benchmark average 6-Region blended nest-run cost of 85.3 cents per dozen during February 2023. This excludes provisions for packing, packaging materials and transport, amounting to 50 cents per dozen in mid-2022, according to the EIC but now probably closer to 55 cents per dozen. The progression of prices during 2023 to date is depicted in the USDA chart reflecting three years of data, updated weekly.
The April 3rd 2023 edition of the USDA Egg Market News Report documented a USDA Combined Region value rounded to the nearest cent, of $3.47 per dozen delivered to warehouses for the week ending March 27th 2023. This average price lags current Midwest weekly values by one week. The USDA Combined range for Large in the Midwest was $3.37 per dozen. At the high end of the range, the price in the South Central region attained $3.57 per dozen. The USDA Combined Price last week was approximately $1.70 above the 3-year average. This past week Midwest Large was approximately $1.55 above the corresponding week in 2022.
Flock Size
The USDA adjusted the estimate of flock size to reflect depopulation of more than 31.1 million hens through June 6th 2022 as a result of the spring wave of HPAI with subsequent depopulation of approximately 14 million additional hens in Ohio, Colorado, Iowa, Oregon and South Dakota during the fall wave ending late-December. According to the USDA the number of producing hens reflecting April 5th (rounded to 0.1 million) was down 1.5 million (0.5 percent) to 298.8 million. The total U.S. flock includes about 3.0 million molted hens due to come back into production with approximately 4.0 million new pullets reaching maturity each week based on USDA chick hatch data. The increase is offset by routine flock depletion in addition to past losses during 2022 due to the HPAI epornitic. Based on inventory level and prices the hen population producing eggs should now be in mild oversupply relative to consumer demand. Industrial and food service off-take although increasing, has not reverted to pre-COVID levels. Prices will continue to fluctuate, trending mildly upward into April 2023. Prices of shell eggs and products will also depend on any future incident outbreaks of HPAI offset by the contribution of new pullets and of molted hens to supply.
According to the USDA the total U.S. egg-flock on April 5th was down 1.5 million hens (0.5 percent) to 306.5 million including second-cycle birds and those in molt. Any difference between hens in production and total hens is an approximate figure but denoting that many molted hens have or will resume production to meet pre-Easter demand. At present there are now at least 20 million fewer hens in both the total and producing flocks with the difference equivalent to about five percent of the pre-HPAI national flock of 325 million hens.
INVENTORY LEVELS
Cold storage stocks of frozen products in selected centers on April 3rd 2023 amounted to 2.386 million pounds (1,085 metric tons) of frozen egg products, up 0.9 percent from the inventory of 2.366 million lbs. on March 1st 2023. The monthly USDA Cold Storage Report below quantifies a reduction in the actual total stock level.
The most recent monthly USDA Cold Storage Report released on March 23rd 2023 documented a total stock of 26.1 million pounds (11,862 metric tons) of frozen egg products on February 28th 2023. This quantity was down 6.7 percent from the February 28th 2022 value of 28.0 million pounds. February 28th 2023 frozen egg inventory was down 9.1 percent from the previous month ending January 31st 2023 despite depletion of 44 million hens in 2022. Compared to February 28th 2022 yolks were up 0.3 percent to 788 million lbs. on February 28th 2023.
A total of 85.3 percent of combined inventory (22.2 million lbs.) comprised the categories of “Whole and Mixed” (43.0 percent) and “Unclassified” (42.3 percent). The lack of specificity in classification requires a more diligent approach to enumerating and reporting inventory by the USDA
Shell Inventory
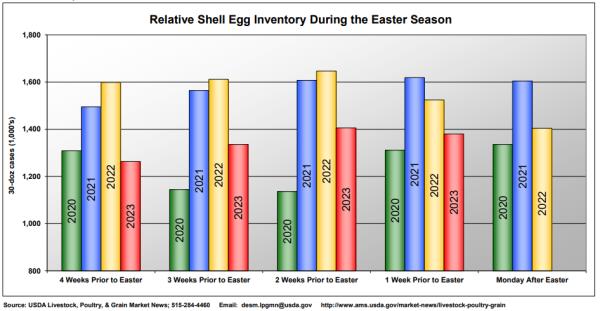
The USDA reported that the national stock of generic shell eggs effective April 3rd 2023 was down 1.2 percent continuing the trend of the previous week. The relative movement of stock over the previous week suggests decreased consumer demand despite the upward price trajectory. Combined with breaking stock, the total inventory of shell eggs in the industry is now at 1.69 million cases (1.71 million last week and 20,500 cases higher). The U.S. population of laying hens at this time is influenced by the number of hens previously culled due to HPAI, and includes the population unaffected by HPAI, flocks retained after molting (with an anticipated increase in this category depending on available housing capacity) and started pullets from chick placements in late October 2022. Going forward, older hens will assume a larger proportion of the national flock as more flocks are molted especially as many “at risk” pullet flocks were depleted due to HPAI.
Three USDA Regions reported lower stock levels this past week. The regions are listed in descending order of stock: -
- The Midwest Region was up 1.8 percent compared to the previous week to 481,300 cases.
- The Southeast Region was up 2.0 percent to 274,500 cases
- The South Central Region was down 4.4 percent to 244,600 cases
- The Southwest Region was down 3.6 percent to 156,400 cases.
- The Northeast Region was down 12.8 percent to 155,500 cases
- The Northwest Region was up 1.1 percent to 67,700 cases
The total USDA six-area stock of commodity eggs comprised 1,690,200 cases, down 1.2 percent, of which 81.7 percent were shell eggs (82.2 percent last week denoting continued demand relative to previous years). The inventory of breaking stock was up 1.6 percent to 310,200 cases. Shell egg inventory was down 1.8 percent attaining 1,380,000 cases. The higher level of breaking stock over the past week is attributed to less diversion to the shell egg market and continued demand for liquids by industry, food service and consumers. The average price for Midwest checks and breaking stock combined was 85.6 percent of the average value of Midwest Extra-large and Large shell eggs (last week 86.9 percent) consistent with slightly higher prices for shell eggs despite continued diversion of uncommitted eggs and less in-line breaking stock consigned to the shell market. The differential can be compared to 80.0 percent in April 2022 reflecting the initial period of high demand for both shell eggs and breaking stock after the onset of HPAI. This past week the wholesale Midwest Extra-large and Large shell egg prices were lower by an average of 9.5 percent compared to breaking stock and checks combined that were down by 16.6 percent on average from the previous week. This demonstrates the respective demands for shell eggs and egg products. There is interconnectivity of the packing and breaking segments of the egg industry under circumstances of extreme disturbances in either supply (HPAI in 2022) or demand (COVID in 2020). The price for breaking stock and for checks is influenced by the relative demand for generic shell eggs and contract obligations with breakers.
On April 3rd 2023 the inventory of other than generic eggs amounting to 417,100 cases (down 0.4 percent from last week at 418,800 cases) among three categories (with the previous week in parentheses) comprised:-
- Specialty category, up 5.1 percent to 47,000 cases. (Was up14.7% to 44,700 cases)
- Certified Organic, up 7.0 percent to 82,500 cases. (Was down 3.3 percent to 77,100 cases)
- Cage-Free category, down 3.2 percent to 287,600 cases. (Was up 7.8% to 297,000 cases)
 |
Demand for cage-free product will not increase materially while generic eggs from caged flocks and some surplus down-classified cage-free eggs are on the shelf at $2.00 to $2.50 per dozen during normal supply conditions over the long term. This is supported by the findings of the comprehensive review relating to the transition from cages to alternative systems.* Existing and proposed individual state legislation mandating sale of only cage-free eggs will support most of the anticipated transition from cages but total re-housing will not be completed by the beginning of 2025, less than 20 months away and by many observers, ultimately never. The constitutional status of Proposition #12 was considered in oral arguments presented to SCOTUS on October 11th with specific reference to the Dormant Commerce Clause relating to interstate trade. Many chains are reneging on or extending their time commitments to achieve an acceptable transition to cage-free eggs. With the current proportion of non-caged flocks, cage-free eggs are surplus to demand in some areas and are becoming a commodity in many markets subjected to the same price pressures as generic eggs from caged hens. Growth in demand for organic product has been static for months.
Long-term demand for cage-free eggs is influenced by the relative shelf prices of the category in comparison with generic white-shelled eggs from caged flocks. At the other end of the price range, consumers will purchase less-expensive brown cage-free product over organic eggs when there is a differential in price greater than about $1.20 per dozen under normal balance between supply and demand. Similarly, consumers will traditionally purchase white-shelled generic eggs in preference to brown-shelled cage-free with a differential of over $1.20 per dozen.
*Caputo,V. et al The Transition to Cage-Free Eggs. February 2023
A comprehensive structured market research project on cage-free eggs has provided an indication of consumer willingness to pay for this attribute. The industry requires a study on other aspects including shell color, GM status and nutritional enrichment. Above all agricultural economists should evaluate the impact of disruption in supply and demand arising from large-scale depopulation following HPAI in 2015 and the ongoing 2022-2023 HPAI epornitic.
RELATIVE PRICES OF SHELL-EGG CATEGORIES
USDA-AMS posted the following national shell egg prices as available, for March 31st 2023 in the Egg Markets Overview report for dozen cartons with comparable prices in parentheses for the previous week: -
Retail
Large, in cartons generic white: $1.75 down 64.6 percent ($4.94)
Large, in cartons cage-free brown: $3.50 (none)
Large C-F, California in Cartons: $4.45 up 6.2 percent ($4.19)
Wholesale
National loose, (FOB dock): $2.04 down 29.9 percent ($2.91)
NYC in cartons to retailer: $3.09 down 12.0 percent ($3.51)
Midwest in cartons to warehouse: $3.38 up 2.7 percent ($3.29)
RELATIVE ADVERTISED PRICES OF SHELL-EGG CATEGORIES
USDA Certified Organic, Brown, Large: (none) (none)
Cage-Free Brown, Large: $3.50 (none)
Omega-3 Enriched Specialty, White, Large: $3.99 ($3.99)
Generic White, Large Grade AA $1.65* ($4.97)
Generic White, Large Grade A (Feature price) $1.75* ($2.94)
* Based on a small sample with few advertised promotions
The advertised price this week for Large white grade A was $1.65 per dozen, down $3.32 per dozen or 66.8 percent from the previous week as a loss leader. Lower shelf prices will increase demand for generic categories given availability and the comparison with higher advertised and actual shelf prices for specialty and cage-free brown eggs. Current supply was probably higher than demand this past week as independent producers continue to divert fewer shell eggs from breaking. Large integrated companies and packers continue delivering to DCs and stores to replenish inventory.
For the current week the USDA were unable to document a benchmark-advertised retail price for certified organic. Two weeks ago USDA posted an advertised price of $3.83 per dozen for cage-free brown. Large week-to-week fluctuations can be expected in the stock of specialty and organic eggs based on the small base of these categories.
Retail demand will continue to be supported by home cooking and baking and reinforced by seasonal dining out as COVID is now almost ignored. Eggs and product purchases will be limited among some demographics by their disposable incomes and inflation.
There was insufficient USDA data on shelf prices this week to calculate retail margins. Demand will increase as chains pass on any reduction in wholesale price for generic eggs.
The inability of the USDA to consistently post retail and promotional prices and the evident disparity between their weekly data and actual shelf prices suggests deficiencies in their systems of price discovery that should be addressed.
Omega-3 enriched comprised 7.7 percent of features compared to 36.7 percent last week. Cage-free comprised 28.1 percent of features. The remainder of features comprised 64.2 percent as generic Large. This confirms that retailers promote generic categories if available in excess of demand and to offer loss leaders with high shelf prices.
USDA Cage-Free Data
According to the latest monthly USDA Cage-free Hen Report released on April 3rd 2023, the number of certified organic hens during March 2023 was up 4.8 percent from February 2023 to 17.6 million.
The USDA reported the cage-free (non-organic) flock in March 2023 to be 4.1 percent higher than in February 2023 to 102.2 million
According to the USDA the population of hens producing cage-free and certified organic eggs in March 2023 comprised: -
Total U.S. flock held for USDA Certified Organic production = 17.6 million (18.0 million in Q4 2022).
Total U.S. flock held for cage-free production = 102.1 million (88.5 million in Q4 2022).
Total U.S. non-caged flock =119.7 million (106.5 million in Q4 2022).
This total value represents 36.9 percent (last month 35.5 percent) of a nominal 324 million total U.S. flock pre-HPAI (but 38.9 percent of the national flock after HPAI mortality to a March complement of 308 million). Hens certified under the USDA Organic program have decreased in proportion to cage-free flocks since Q1 of 2021.
The accuracy of individual monthly values is questioned given a history of either sharp changes or no change in successive months as documented over the past two years. Precise quarterly reports would be more suitable for the industry in planning expansion and allocation of capital.
Processed Eggs
For the processing week ending April 1st 2023 the quantity of eggs processed under FSIS inspection during the week as reported on April 5th 2023 was up 3.2 percent compared to the previous processing week to a level of 1,423,134 cases, (1,378,851 cases last week). The proportion of eggs broken by in-line complexes was 52.2 percent (52.1 percent in-line for the previous week) indicating relatively stable proportions of contract and purchased eggs broken. The differential in price for shell sales and breaking will determine the movement of uncommitted eggs. This past week 69.8 percent of egg production was directed to the shell market, (71.0 percent for the previous week) responding to relatively higher prices paid by packers. Breaking stock inventory was up 1.6 percent this past week to 310,200 cases despite diversion to shell-egg markets. Increased demand from QSRs and casual dining, with apparent continued demand from baking and eat-at-home has contributed to higher inventory of breaking stock. During the corresponding processing week in 2020 (during-COVID) in-line breakers processed 55.1 percent of eggs broken.
For the most recent monthly report for week ending March 8th 2022, yield from 5,799,495 cases (5,657,220 cases last month) denoted a slight increase in demand for liquid over the period January 29th through February 25th 2023. Edible yield was 41.7 percent, distributed in the following proportions expressed as percentages: - liquid whole, 62.1; white, 23.1; yolk, 11.6; dried, 2.9.
All eggs broken during 2022 attained 76.22 million cases, 2.0 percent less than 2021. Eggs broken in 2023 to date amounted to 18,464,081 cases, 7.5 percent less than the corresponding period in 2022. This is attributed to decreased demand for egg liquids from retail, food service and QSRs and casual dining restaurants despite restoration of service as COVID restrictions are successively relaxed.
PRODUCTION AND PRICES
Breaking Stock
The average price for breaking stock was down 17.2 percent this past week to an average of 240 cents per dozen with an extreme range of 200 to 280 cents per dozen delivered to Central States plants on April 3rd. Checks were down 14.9 percent this past week to an average of 239 cents per dozen over the most frequent range of 238 to 240 cents per dozen suggesting that the market for breaking stock that bottomed three weeks ago before rising is now past the annual high point.
Shell Eggs
The USDA Egg Market News Report dated April 3rd 2022 confirmed that Midwest wholesale prices for Extra-large and Large sizes were down by 9.5 percent on average compared to the previous week. Mediums were down by 10.9 percent. Prices for generic shell eggs were higher for five consecutive weeks after seven weekly decreases with mostly upward fluctuation in weekly inventory. This suggests moderate decline after the Easter weekend celebrated from April 7th to 10th. The following table lists the “most frequent” ranges of values as delivered to warehouses*: -
|
Size/Type
|
Current Week
|
Previous Week
|
|
Extra Large
|
305-308 cents per dozen
|
337-340 down 9.5%
|
|
Large
|
303-306 cents per dozen
|
335-338 down 9.5%
|
|
Medium
|
260-263 cents per dozen
|
292-295 down 10.9%
|
|
Processing:-
|
|
Breaking stock
|
200-280 cents per dozen
|
265-315 down 17.2%
|
|
Checks
|
238-240 cents per dozen
|
280-282 down 14.9%
|
*Store Delivery approximately 5 cents per dozen more than warehouse price
The April 3rd 2023 Midwest Regional (IA, WI, MN.) average FOB producer price, for nest-run, grade-quality white shelled Large size eggs, with prices in rounded cents per dozen was down 13.2 percent from last week, (with the previous week in parentheses): -
- $2.80 ($3.21), (estimated by proportion): L. $2.77 ($3.19): M. $2.32 ($2.74)
The April 3rd 2023 California price per dozen for cage-free, certified Proposition #12 compliant Large size in cartons delivered to a DC, (with the previous week in parentheses) was down 10.6 percent from last week.
- $4.12 ($4.56); L. $3.98 ($4.45); M. $3.54 ($4.01)
(See the text, tables and figures and the review of production data and prices comprising the USDA Report for February 2023 and the 3rd Quarter FY 2023 results for Cal-Maine Foods under the Statistics Tab)
Shell-Egg Demand Indicator
The USDA-AMS Shell Egg Demand Indicator for APRIL 5thwas down 0.4 points from the last weekly report to -8.6 with a 1.2 percent decrease in total inventory and 1.8 percent lower shell inventory from the past week as determined by the USDA-ERS as follows: -
|
Productive flock
|
298,834,819 million hens
|
|
Average hen week production
|
81.2%(was 81.3%)
|
|
Average egg production
|
242,568,793 per day
|
|
Proportion to shell egg market
|
69.8% (was 71.0%)
|
|
Total for in-shell consumption
|
470,497 cases per day
|
|
USDA Shell Inventory
|
1,380,000 cases
|
|
26-week rolling average inventory
|
4.26 days
|
|
Actual inventory on hand
|
4.66 days
|
|
Shell Egg Demand Indicator
|
-8.6 points (was -48.2 on March 29th 2023)
|
Note 1: USDA Flock numbers were adjusted after incident cases of HPAI in mid-May 2022. The latest estimate of hen population takes into account the depletion of approximately 44 million hens in 22 large complexes (holding over 500,000 hens) in addition to smaller units in eleven states.
Dried Egg Products
The USDA extreme range in prices for dried albumen and yolk products in $ per pound was released on March 31st 2023. Data posted by the USDA is incomplete but available values are depicted for the previous week and past months to illustrate the trend in prices influenced by HPAI depopulation and subsequent repopulation:-
|
Whole Egg
|
$10.50 to $14.25
|
Average Dec. $12.50
Jan. $12.50
Feb. $11.08
March $11.75
|
|
Yolk
|
$9.50 to $12.25
|
Average Dec. $14.65
Jan. $14.65
Feb. $11.94
March $11.23
|
|
Spray-dried white
|
No quotation, past week
|
Average Dec. $14.18
Jan. $14.18
Feb. No release
|
|
Blends
|
No quotation, past week
|
Frozen Egg Products
The USDA range in prices for frozen egg products in cents per lb. on March 31st 2023 compared to the previous week were on average lower but indicating a balance between available products and demand from the manufacturing and retail sectors: -
|
Whole Egg
|
$2.52 - $2.64
|
$2.47 - $2.62
|
|
White
|
$2.07 - $2.10
|
$1.86 - $2.07
|
|
Average for Yolks
|
$3.40 - $3.45
|
$3.30 - $3.37
|
Liquid Egg Products
The March 2023 averages for non-certified truckload quantities are tabulated (cents per lb.) with February 2023 values in parentheses are: -
Whole, 203c (160c); Whites, 149c (135c); Yolks, 307c (309c).
The USDA has not released a report on dried egg inventory since March 13th 2020 due to inability to obtain data from producers, and will not issue reports for the immediate future.
COMMENTS
The 2022 pattern of shedding by migratory birds is expected in 2023 with cases in the Maritime Provinces of Canada already diagnosed followed by extension along the Atlantic Flyway. Outbreaks of H5N1 HPAI should be expected in backyard flocks and combinations of commercial egg complexes, broiler and turkey growing farms among the four flyways. It is evident that some wild domestic birds continue to shed virus based on cases in backyard flocks. This situation requires more intensive monitoring including wild endemic birds and small mammals with guidance by USDA-APHIS to maintain high levels of biosecurity.
Outbreaks in commercial egg-producing flocks have extended from February 23rd 2022 to March 15th 2023 albeit small units since mid-December 2022.
To date approximate losses in commercial flocks with confirmed HPAI and updates include:-
- 2,900,000 broilers on 18 farms in 7 states For 2023 to date losses are 450,000
- 330,000 broiler breeders on 11 farms in 6 states.
- 9,800,000 turkeys including a few breeder flocks on 229 farms in 7 states. For 2023 to date losses are 127,000
- 44,000,000 egg-production hens in total with 95 percent on 22 large complexes above 0.5 million in addition to 1,070,000 pullets with a total of 41 locations in 11 states. Pullet mortality does not include “at risk” replacements depleted on affected complexes with contiguous pullet rearing.
For calendar 2022 through March 28th 2023, 323 commercial flocks were infected with 5 in March. In addition there were 493 diagnosed backyard flocks with 34 during March. Losses of among commercial species have totaled 58.6 million commercial birds. (WOAH reported). To date 47 states, involving 400 counties have recorded at least one case involving wild birds, backyard flocks, commercial farms or their combination.
Mexico has depopulated 5.5 million commercial poultry, predominantly egg-producing flocks. One million have been depleted year-to-date
From April 2022 through mid-January 2023, Canada recorded 299 outbreaks in commercial flocks in nine Provinces and has depopulated 7.2 million commercial poultry including hens, turkeys and broilers. In addition numerous confirmations of HPAI were made in backyard and subsistence flocks. Isolation of H5N1 avian influenza in wild birds and backyard flocks is a function of surveillance intensity.
Collectively the USMCA nations have depopulated approximately 70 million birds in at least 700 flocks.
France and Holland are evaluating AI vaccines. Mexico has introduced vaccination. An International conference on vaccination against HPAI took place in Paris on October 25th and 26th and considered trade barriers to implementation of vaccination.
Backyard flocks that are allowed outside access will continue to be at risk of infection in the U.S. These small clusters of birds in suburban areas are of minimal significance to the epidemiology of avian influenza as it affects the commercial industry. Backyard flocks serve as indicators of the presence of virus among free-living birds as evidenced by ongoing outbreaks in commercial poultry flocks across the U.S.
The level of biosecurity in commercial egg production complexes and broiler farms is appreciably higher than in 2015 when the U.S. experienced an epornitic along the Mississippi Flyway The response of state and federal authorities since this time has been rapid and effective both in diagnosing and depleting affected flocks. To date, all floor-housed flocks that were infected were depopulated using foam. Euthanasia of egg production complexes involved various combinations of VSD+ applying heat or carbon dioxide or conventional kill-carts flushed with carbon dioxide.
The role of migratory waterfowl in introduction and subsequent dissemination of H5N1 HPAI virus is indicated by the close proximity of infected complexes and their counties with major waterways, lakes, wetlands or reservoirs during the spring and fall months of 2022. There is now limited subjective evidence of aerogenous transmission of HPAI over short distances with virus (possibly shed by wild endemic and migratory birds) becoming entrained in dust and introduced into ventilation inlets by powered ventilation systems.
It would have been of practical and financial benefit for APHIS epidemiologists to have reported on their findings from the questionnaires completed following outbreaks on commercial farms. Given the costs to the private and public sectors and to consumers priority should have been extended to the first seven large egg complexes affected. Case-comparison studies against representative unaffected complexes should have been performed using specific and relevent questionnaires. This would have provided advice to producers on risk factors. The industry should have been advised of likely routes of infection including possible aerogenous spread and whether any obvious defects in structural or operational biosecurity contributed to outbreaks. This would have facilitated appropriate preventive action and allocation of additional resources to intensified biosecurity.
A preliminary opinion with guidance during mid-April 2022 concentrating on large egg complexes was not an unrealistic request. This is especially the case since large egg complexes in Northwest Ohio and in Colorado were infected during September, in Iowa in October and again in November and in Oregon and South Dakota during early December 2022. This suggests ongoing exposure from wild domestic birds and possibly mammals in addition to migratory waterfowl as evidenced by the increasing incidence in backyard flocks that effectively serve as sentinels. An interim report was released during the first week of March 2023, inexplicably backdated to July 2022. This document, lacking either conclusions or recommendations was critiqued in a special edition of EGG-NEWS on March 8th.