Status of 2021 Corn and Soybean Crops
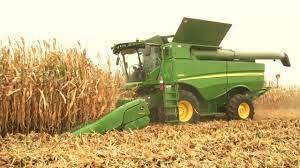
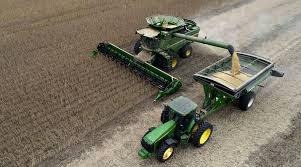
 The USDA Crop Progress Report released on September 27th documented corn and soybean crop conditions to September 26 th compared to 5-year averages. This past week 97 percent of corn was at the dent stage. Approximately 74 percent of the corn crop was mature, 10 percent ahead of the 5-year average. Eighteen percent has been harvested. For soybeans 75 percent of the crop was dropping leaves consistent with the 5-year average and 16 percent has been harvested, an advance of 10 percent in a week.
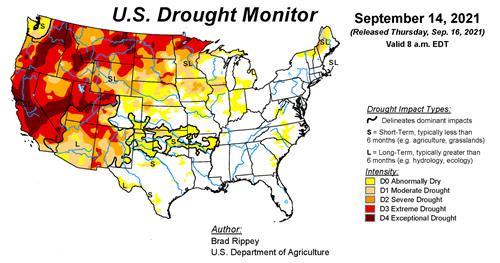
Surface moisture levels were relatively higher during the past week over the corn-belt attaining an average of 26.5 percent for areas classified in the two lowest categories of “Short” and “Very short”. The severe drought in Western states and the Dakotas continues with extensive wildfires in the Northwest. Topsoil moisture in Iowa was up this past week to 36 percent compared to 40 percent last week in the two lowest moisture categories. High topsoil moisture levels and rain at the time of harvest will result in higher moisture levels in corn with a propensity for mycotoxicosis.
Despite the variable levels of topsoil moisture among states, approximately 59 percent of the corn crop was classified by USDA under the “Good” and “Excellent” categories, unchanged from last week. The corresponding figure for soybeans was 58 percent, also unchanged from last week.
The ProFarmer Crop Tour completed three weeks ago, estimated corn yield to range from 175.2 to 178.8 bushels per acre with a mean value of 177.0 bushels per acre compared to the September WASDE value of 176.3 bushels per acre. This corresponded to a projected range for the 2021 corn harvest of 14.965 to 15.265 billion bushels with a mean value of 15.116 billion bushels compared to the September WASDE value of 14.996 billion bushels.
The ProFarmer Crop Tour estimated the soybean yield to range from 50.2 to 52.2 bushels per acre with a mean value of 51.2 bushels per acre compared to the September WASDE value of 50.6 bushels per acre. This corresponded to a projected range for the 2021 soybean harvest of 4.347 to 4.525 billion bushels with a mean value of 4.525 billion bushels compared to the September WASDE value of 4.374 billion bushels.
CHICK-NEWS and EGG-NEWS will report on the progress of the two major crops as monitored by the USDA through the end of the 2021 harvest in November.
Reference is made to the September 10th WASDE Report #616 and the Acreage Report retrievable under the STATS tab for projected 2021 acreage and yields. This data will be updated when WASDE #617 is released on Friday October 8th with a firmer projection of yields, ending stocks and markets.
| |
WEEK ENDING
|
|
|
Crop
|
September 19th
|
September 26th
|
5-Year Average
|
|
Corn Dough (%)
Corn Dented (%)
Corn Mature (%)
Corn Harvested (%)
|
100
93
57
10
|
100
97
74
18
|
100
94
64
15
|
| |
|
|
|
|
Soybeans Dropping leaves (%)
Soybeans Harvested (%)
|
58
6
|
75
16
|
66
13
|
| |
|
|
|
| |
|
|
|
|
|
 |
|
Crop Condition
18 States
|
V. Poor
|
Poor
|
Fair
|
Good
|
Excellent
|
|
Corn 2021 (%)
Corn 2020 (%) 1
1. Late planting
|
5
5
|
10
9
|
26
25
|
45
47
|
14
14
|
|
Soybeans 2021 (%)
Soybeans 2020 (%)1
1. Late planting
|
4
3
|
10
7
|
28
26
|
47
51
|
11
13
|
|
 |
|
Parameter 48 States
|
V. Short
|
Short
|
Adequate
|
Surplus
|
|
Topsoil moisture %: Past Week*
|
19
|
31
|
46
|
4
|
|
Past Year
|
16
|
29
|
51
|
4
|
|
Subsoil moisture %: Past Week
|
21
|
31
|
46
|
2
|
|
Past Year
|
16
|
28
|
52
|
4
|
|
For topsoil moisture the major corn and soybean-producing states had an average of 26.5 percent in the “Very Short” and “Short” categories (last week 35.2 percent) with a range of zero percent for PA to 58 percent for KS.
- Iowa 36% (was 40%)
- Illinois 40% (was 38%)
- Indiana 20% (was 51%)
- Kansas 58% (was 49%)
- Kentucky 13% (was 18%)
- · Michigan 8% (was 22%)
- Missouri 48% (was 43%)
- Ohio 10% (was 50%)
- Pennsylvania 0% (was 6%)