
|
|
|
 |
 |
 |
|
EGG‑NEWS.com
Egg Industry News, Comments & More by
Simon M.Shane
|
|
 |
|
 |
|
 |
Egg Industry Articles
Egg Exports
|
03/08/2024 |
|
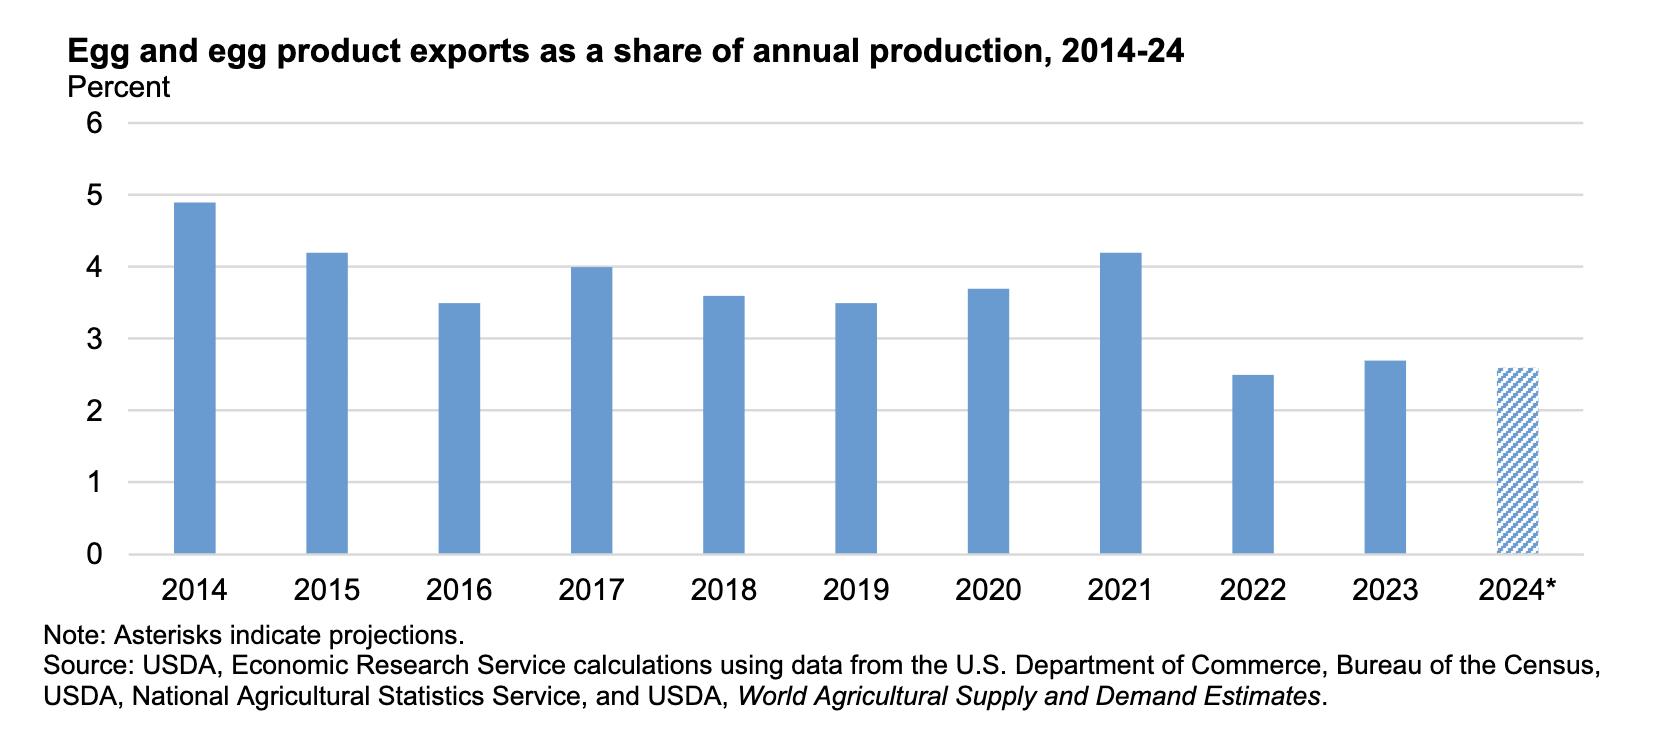
 Exports of shell eggs during the 12-month period commencing March 2022 were constrained by availability due to progressive and cumulative depletion of 44 million hens as a result of HPAI divided among spring and fall waves. The national flock was about 20 million hens lower than the pre-HPAI complement on an average weekly basis during 2022. Sharp rises in price as a result of supply-demand disequilibrium made U.S. export prices non-competitive as denoted by lower volumes over successive months from March 2022. Egg products were also impacted but to a lesser extent than shell eggs. During June 2023 shell and product exports combined represented 2.5 percent of total production, more than double the volume recorded in January 2023 but exports declined in July to 1.9 percent of production by U.S. flocks. At the present time the national flock is approximately 17 million hens lower than pre-HPAI levels with relatively high prices sufficient to constrain exports of shell eggs. Combined shell and product exports in December 2023 represented 2.6 percent of the output of the national flock. It is questioned whether lost markets other than the USMCA and Caribbean nations will be reclaimed over the intermediate term. Sporadic and short-term exports may be made to various nations based on supply disruption caused by HPAI. Exports of shell eggs during the 12-month period commencing March 2022 were constrained by availability due to progressive and cumulative depletion of 44 million hens as a result of HPAI divided among spring and fall waves. The national flock was about 20 million hens lower than the pre-HPAI complement on an average weekly basis during 2022. Sharp rises in price as a result of supply-demand disequilibrium made U.S. export prices non-competitive as denoted by lower volumes over successive months from March 2022. Egg products were also impacted but to a lesser extent than shell eggs. During June 2023 shell and product exports combined represented 2.5 percent of total production, more than double the volume recorded in January 2023 but exports declined in July to 1.9 percent of production by U.S. flocks. At the present time the national flock is approximately 17 million hens lower than pre-HPAI levels with relatively high prices sufficient to constrain exports of shell eggs. Combined shell and product exports in December 2023 represented 2.6 percent of the output of the national flock. It is questioned whether lost markets other than the USMCA and Caribbean nations will be reclaimed over the intermediate term. Sporadic and short-term exports may be made to various nations based on supply disruption caused by HPAI.
USDA-FAS data collated by USAPEEC, reflecting export volume and values for shell eggs and egg products are shown in the table below comparing 2023 with 2022:-
|
PRODUCT
|
Jan. 2023
|
Jan. 2024
|
Difference
|
|
Shell Eggs
|
|
|
|
|
Volume (m. dozen)
|
5.7
|
4.6
|
-1.1 (-19.3%)
|
|
Value ($ million)
|
17.0
|
8.7
|
-8.3 (-48.8%)
|
|
Unit Value ($/dozen)
|
2.98
|
1.89
|
-1.09 (-36.5%)
|
|
Egg Products
|
|
|
|
|
Volume (metric tons)
|
1,652
|
2,083
|
+431 (+26.1%)
|
|
Value ($ million)
|
10.7
|
11.3
|
+0.6 (+5.6%)
|
|
Unit Value ($/metric ton)
|
6,476
|
5,424
|
-1,052 (-16.2%)
|
U.S. EXPORTS OF SHELL EGG AND EGG PRODUCTS DURING
JANUARY 2024 COMPARED WITH 2023
SHELL EGGS
Shell egg exports from the U.S. during January 2024 decreased by 19.3 percent in volume and 48.8 percent in total value compared to 2023. Unit value declined 36.5 percent to $1.89 per dozen compared to the corresponding month in 2023.
Canada was the leading importer of shell eggs during January 2024, with 2.2 million dozen representing 47.8 percent of volume and 47.1 percent of the $8.7 million total value of U.S. shipments of shell eggs. Unit price in January 2024 was $1.86 per dozen compared to $3.23 per dozen for consignments in January 2023. Imports by Canada are driven by consumer demand balanced against availability from the controlled supply situation in Canada. This inhibits flexibility necessitating imports from the U.S. to cater for demand.
The Bahamas was a distant second in shell egg imports from the U.S. during January 2024, with 0.6 million dozen representing 13.0 percent of volume and 12.6 percent of the total value of U.S. shipments of shell eggs. Unit price in January 2024 was $1.83 per dozen

Mexico was the third-ranked importer of shell eggs in January 2024 with a volume of 0.4 million dozen representing 8.9 percent of export volume and 6.9 percent of value. This price discrepancy was due to a low unit value of $1.50 per dozen compared to an average value of $1.89 per dozen for all exports.
During January 2024 the next three significant importing nations (Netherlands Antilles, Cayman Islands and Hong Kong.) with a collective volume of 0.5 million dozen represented 10.9 percent of U.S. exports. Value of exports to these importing nations amounted to $0.8 million in January 2024 compared to $1.1 million in January 2023. Unit price for these importers in January 2024 averaged $1.60 per dozen, compared to the January 2024 average USDA export price of $1.89, per dozen, tray packed, excluding processing but with inland transport and outer cartons. The average 12-month trailing USDA benchmark price for nest-run large shell eggs was $1.37* per dozen weighted by high prices during shortages during the second half of 2022 and the first quarter of 2023 resulting from depletion of flocks infected with HPAI.
*USDA 12-month USDA benchmark nest-run unit prices per dozen: February 2023, $2.13; March, $2.74; April, $1.38; May, $0.60; June, $0.82; July, $0.83 and August, $0.90; September, $1.00; October, $0.89; November, $1.65; December, $1.81 and January 2024, $1.72.
EGG PRODUCTS
The total volume of exported egg products during January 2023 increased 26.1 percent to 2,083 metric tons compared to January 2023. Total value of $11.3 million was higher by 5.6 percent compared to January 2023. Unit value decreased by 16.2 percent to $5,424 per ton compared to January 2023. During 2023 the U.S. exported 29,814 metric tons of egg products valued at $134.3 million with a unit price of $4,505 per metric ton. Fluctuation in unit price reflects the composition of exports and the relationship between World supply and demand. Ukraine is now restrained in production but India continues as a significant exporter.
Mexico was the 1st-ranked importer by volume of egg products during January 2024 receiving 672 metric tons from the U.S. valued at $2.4 million representing 32.3 percent of volume and 21.2 percent of value with a unit price of $3,571 per metric ton. Volume for January 2024 was up by 47.1 percent but value was lower by 17.2 percent compared to January 2023.
Japan fell to the 2nd ranked importer from the U.S. during January 2024 based on a volume of 382 metric tons with a value of $1.7 million, representing 18.5 percent of volume and 15.0 percent of the total value of U.S. exports of egg products. Exports to Japan fell by 35.5 percent in volume and 34.6 percent value compared to January 2023. The unit value of $4,392 per metric ton can be compared with the average unit value for U.S. exports of all egg products at $5,425 per metric ton. During 2023 Japan imported 10,352 metric tons of egg products from the U.S., valued at $49.9 million. With the conclusion of a bilateral trade agreement, the U.S. is no longer at a competitive disadvantage with respect to the E.U.
South Korea was ranked third among importers of egg products during January 2024 with a volume of 315 metric tons valued at $1.2 million. Most flocks in South Korea have been restored to production after depopulation following 2021-2022 outbreaks of HPAI. Import volume may have been influenced by limited but rising flock depletion or alternatively increased demand in advance of the Lunar New Year. In 2023 South Korea imported 1,141 metric tons valued at $5.3 million. Imports to South Korea resumed during November 2023 and continued through December with 237 metric tons valued at $0.7 million. Depending on severity, the return of HPAI may result in a disparity between local availability and demand requiring imports in 2024 as in 2022
Canada was the 4th-ranked importer in January 2024 based on a volume of 240 metric tons with a value of $1.1 million. Canada represented 11.5 percent of volume and 9.7 percent of value with a unit price of $4,583 per metric ton. Volumes shipped reflect restoration of the institutional and food service sectors and relative availability of domestic product in Canada.
COMMENTS
During 2021 the value of shell eggs and egg products attained $101.8 million or 32.7 percent of combined export value. Exports in 2022 amounted to $126.5 million in value equivalent to 47.5 percent of the combined value of shell eggs and products. During 2023 exports valued at $150.7 million represented 50.8 percent of shell egg and egg products amounting to $296.5 million. Canada represented 59.0 percent of the $162.2 million for shell eggs and 10.3 percent of egg products valued at $121.2 million, shipped during 2023, emphasizing dependence on this USMCA partner. During January the USMCA represented 41 percent of combined shell egg and product sales valued at $20 million.
Aspirational volumes of exports in excess of five percent of domestic production are unrealistic. Japan, South Korea and Taiwan will buy according to their needs for undifferentiated shell eggs and products based on landed price in a competitive World market. Purchase decisions for commodities are determined by FOB price, freight, duty and broker margins. Shell eggs and the various categories of egg products are essentially commodities and are non-responsive to promotion.
Exports will be dependent on the willingness of importers to accept the World Organization for Animal Health (WOAH) principle of regionalization (zoning) in the event of outbreaks of exotic Newcastle disease or isolation of either H5 or H7 avian influenza (AI), in commercial flocks, irrespective of pathogenicity. Most importing nations are now applying regionalization and permitting imports on a zonal, county or state-exclusion basis following H5 or H7 AI infection. Canada and the U.S. operate according to a 2018 bilateral agreement to maintain trade in the event of outbreaks of catastrophic exotic diseases including HPAI and END.
Generally pasteurized egg products should not be subject to any embargo imposed following reports of AI or Newcastle disease in a region.

|
Uzelac Rotary Drying Systems to Process Layer Manure
|
05/03/2021 |
|
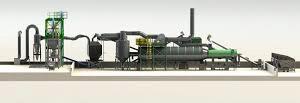
 Application of Uzelac Manure Drying Systems. Application of Uzelac Manure Drying Systems.
Uzelac Industries based in Greendale, WI. has developed considerable expertise in the design and installation of rotary drum dryers capable of reducing the moisture content of manure from high-rise houses with 65 percent water or belt systems with 45 percent water down to 15 percent. Manure handling and drying installations convert a waste product into a valuable pathogen-free fertilizer in a commercially acceptable form for domestic and institutional applications.
Direct application of raw manure to farmland will be subject to increasing restriction as nitrogen percolating through soil contaminates ground water and hence wells. Runoff entering streams and waterways will come under heightened scrutiny from state and federal regulators.
A Uzelac rotary dryer installations reduces odor, obviating complaints and lawsuits and when used with belt manure collection, effectively eliminates fly problems without expenditure on insecticides. In the future environmental regulations may necessitate on-farm or remote processing of manure before application.
A typical Uzelac on-farm or remote installation comprises:-
- Hoppers to accumulate raw material conveyed from houses or delivered from farms
- A mixer to ensure that raw material is uniform in composition before processing
- An air-heater assembly to fire the rotary drum dryer configured to the volume of input
- A product collector to receive processed, dried material
- A dust cyclone to limit air contamination
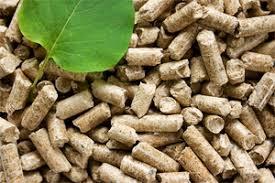
- An optional pellet mill and pellet cooler to convert processed material into a saleable form
- Packaging systems for either pelleted or granular products or a storage and delivery system for bulk product
Current Uzelac customers in the U.S. poultry industry include Herbruck’s Poultry Ranch, Giroux’s Poultry Farm, Michael Foods, Foster Farms and Tyson Foods among others.
Financial Evaluation of Uzelac Manure Drying Installations
Calculating the return from an investment in a manure drying installation is dependent on a number of factors including:-
- Housing system such as high-rise, belt battery or aviary that will influence the moisture content of raw manure.
- Prevailing power, gas and labor costs.
- Single or two-shift operation to process manure from a complex or combination of smaller operations.
- Seasonal climatic conditions with hot weather increasing water consumption of a flock, leading to manure with a higher moisture content
- Size of supply flock influencing initial capital cost and utilization. Some installations are sited remotely to receive manure from a number of farms or complexes.
- Form of product sold, whether bulk or bagged, granular or pelleted, will determine unit revenue.
- State or local grants to offset capital cost.
- Prevailing interest rates.
In order to calculate the return on investment from a manure-drying installation the following boiler-plate examples are provided. The first model assumes single shift operation, 40 hours/week; processing manure from one million hens in aviaries. The format allows insertion of specific values relating to a complex:-
Capital cost of a Uzelac manure drying installation.
|
Buildings and installations
|
$1,060,000 |
|
Mechanical equipment
|
$2,945,000 |
|
Total Capital cost
|
$4,005,000 |
|
Annual Fixed Cost of Operation :
|
|
Depreciation, Buildings @ 7% pa
|
$ 74,200 |
|
Depreciation, Equipment @ 15% pa
|
$ 441,750 |
|
Interest on capital @ 3% pa
|
$ 120,150 |
|
Overhead provision
|
$ 10,000 |
|
Annual Fixed Cost
|
$ 646,100 |
|
Annual Variable Cost of Single-shift Operation
|
|
Labor
|
$ 150,000 |
|
Maintenance provision
|
$ 50,000 |
|
Power Estimate
|
$ 250,000 |
|
Annual Variable Cost
|
$ 450,000 |
|
Annual Cost of Operation
|
$1,096,100 |
In assessing the return on investment it is assumed that 1,000,000 hens in aviary houses produce 35,000 tons raw manure each year with 45 percent moisture content dried to 15 percent resulting in 24,500 tons of saleable product.
|
Revenue from dry product @ $145 per ton
|
$3,552,500 |
|
Less value of wet manure @ $10 per ton
|
$ 350,000 |
|
Differential in revenue
|
$ 3,202,500 |
|
Add saving on fly and rodent control
|
$ 10,000 |
|
Annual Revenue
|
$ 3,212,500 |
|
Less Annual Fixed and Variable Costs
|
$ 1,096,100 |
|
Annual Contribution
|
$ 2,116,400 |
Discounted Cash Flow Calculation
In order to evaluate the capital cost of the manure drying installation the annual contribution over a five-year period would be:-
| Year |
1 |
2 |
3 |
4 |
5 |
|
5% discount factor
|
0.95 |
0.91 |
0.86 |
0.82 |
0.78 |
|
Annual Revenue ($ mil.)
|
2.01 |
1.93 |
1.82 |
1.74 |
1.65 |
Net Present value over 5 years attains $9.15 million
This exceeds Present Value applying 5% annual discount factor
Discounted payback of 25 months
In evaluating the effect of selling price as the major variable influencing ROI a series of DCF calculations were performed yielding the following results:-
Selling Price per ton Net present Value of Investment over 5 years
| $ 75 |
$1.74 million |
| $ 85 |
$2.79 million |
| $105 |
$4.91 million |
| $125 |
$7.03 million |
| $145 |
$9.15 million |
The return on investment is extremely sensitive to unit selling price. At $105 per ton the project would require 47 months to achieve a breakeven net present value of $4 million, corresponding to the original capital investment.
In demonstrating the influence of volume and price on the return on investment the manure-drying installation was evaluated with the theoretical output of 2 million hens, operating the Uzelac plant on a double-shift schedule 80 hours per week, corresponding to five, 16-hour working days. In this approach in the interests of simplicity, fixed costs of $646,100 would remain unaltered but variable costs would double to $900,000.
Annual Cost of Operation $1,546,100
In assessing the return on investment it is assumed that 2,000,000 hens produce
70,000 tons wet manure each year at 45 percent moisture content dried to 15 percent resulting in
49,000 tons of saleable product.
| Revenue from dry product @ $145 per ton |
$7,105,000 |
| Less value of wet manure @ $10 per ton |
$ 700,000 |
| Differential in revenue |
$ 6,405,000 |
| Add saving on fly and rodent control |
$ 20,000 |
| Annual Revenue |
$ 6,425,000 |
| Less Annual Fixed and Variable Costs |
$ 1,546,100 |
| Annual Contribution |
$ 4,878,900 |
Discounted Cash Flow Calculation
In order to evaluate the capital cost of the manure drying installation the annual contribution over a five-year period would be:-
| Year |
1 |
2 |
3 |
4 |
5 |
| 5% discount |
0.95 |
0.91 |
0.86 |
0.82 |
0.78 |
| Annual Revenue ($ mil) 4.63 4.44 4.20 4.00 3.81 |
Net Present value over 5 years attains $21.08 million
Exceeds Present Value by a factor of 5 applying a 5% annual discount factor
Discounted payback period of 10 months
In evaluating the effect of selling price as the major variable influencing return, a series of DCF calculations were performed yielding the following results:-
Selling Price per ton Net present Value of Investment over 5 years
| $ 75 |
$ 6.27 million |
| $ 85 |
$ 8.37 million |
| $105 |
$12.61 million |
| $125 |
$16.84 million |
| $145 |
$21.08 million |
The return on investment is extremely sensitive to unit selling price. At $75 per ton the project would require 37 months to achieve a breakeven net present value of $4 million, corresponding to the original capital investment.
The calculations provided assume manure from an aviary house with 45 percent moisture. Manure from high-rise complexes with moisture content of 65 percent would require a higher drying capacity with proportional increases in capital and operating costs to reduce moisture content to 15 percent.
Uzelac manufactures components for rotary drying systems that can be adapted in capacity and layout to suit specific applications. Uzelac engineers are available to review specifications and to design custom installations.
Additional information on Uzelac installations can be accessed by clicking on to the Uzelac logo on the right side of the welcome page or on www.uzelacind.com or (414) 529 0240 - contact Mike Terry.
|
What Does the Latest Study on Eggs and Cholesterol Mean?
|
02/10/2021 |
|
Mickey Rubin, PhD, Executive Director, Egg Nutrition Center
Many of you may have seen the headline this morning touting another study on eggs and cardiovascular disease, with the headline “Are eggs good or bad for you? The truth may be somewhere in between.” This is one where your readers, followers or patients may have questions. I would encourage you to read past the headline because there are some important points made by experts, including Dr. Walter Willett from the Harvard School of Public Health.
“The study results are problematic because they only asked people once about their egg consumption, then followed them for many years without checking to see if their diet had changed” according to Dr. Willett, while other experts in the same article stated that "The conclusions of this study are overblown.”
What does the latest study on eggs and cholesterol mean? See below for a brief summary of the results and the broader context:
- This new study reported an increased risk for all-cause mortality, cardiovascular mortality, and cancer mortality.
- However, this study was limited by the fact it only assessed diet once at the start of the study 25 years ago and then never again.
- In contrast, a stronger study from the Harvard School of Public Health assessed diet multiple times over decades and found no link between egg intake and cardiovascular risk.
- Several studies published just in the last year on the topic of eggs, dietary cholesterol, and cardiovascular risk contradict the findings from this new study, including the Harvard study linked above, a meta-analysis of 23 studies that found egg intake reduced the risk of coronary artery disease, as well as a global analysis across 50 countries that found no link between eggs and cardiovascular disease.
- One point not discussed extensively in this new study or the news article is the finding that consumption of eggs was linked to a reduced risk of Alzheimer’s disease. While this should be viewed in the context of the limitations of the study described above, this is consistent with other studies on choline – a nutrient for which eggs are an excellent source - that have shown favorable results for cognitive outcomes and reducing risk for dementia.
- Finally, recent guidance from the American Heart Association (AHA) as well as the Dietary Guidelines for Americans 2020-2025 that have assessed the totality of evidence on the topic state that eggs can be a part of heart-healthy diet patterns.
- The AHA stated in 2019 that healthy individuals can include up to a whole egg daily in heart-healthy dietary patterns, older healthy individuals can include up to 2 eggs per day in heart-healthy diets, and vegetarians who do not consume meat-based cholesterol-containing foods may include more eggs in their diets within the context of moderation.
- The Dietary Guidelines for Americans 2020-2025 include eggs in all recommended healthy eating patterns starting from when children are first introduced to solid foods.
As always, there are often competing headlines in nutrition science, with one study showing one thing, and another study showing the opposite. Rather than getting caught with nutrition science whiplash, it is important not to focus too much on any one study, but rather view the research in totality. As is reflected in the latest nutrition guidance, nutrient-rich eggs are an important part of healthy dietary patterns across the lifespan.
|
Validating Feed Mixing with Micro-Tracers®
|
01/16/2021 |
|
 Article by David and Zachary Eisenberg Article by David and Zachary Eisenberg
Microtracers® are used worldwide to assure quality of mixed feeds. They are used to identify the presence of additives and premixes in final feeds and to confirm the integrity of proprietary pharmaceuticals. In the poultry industry Microtracers® validate cross-contamination control procedures to prevent violative residues. This article describes the procedure to verify the accuracy of feed mixing.
The cost of validating the accuracy of mixers is trivial when compared with the costs of non-uniform diets that may impact animal performance. Inefficient mixer performance will require longer mixing times or smaller batch sizes than needed, wasting resources and reducing feedmill capacity.
Microtracers® provide significant advantages over alternate tracers used to validate mixing including assays of amino acids, minerals and salt.
- Microtracers® can be assayed either in a mill by non-technical personnel or in a feed laboratory. Assays are conducted rapidly and at a fraction of the cost of amino acid or mineral analyses.
- Microtracers® are added to feeds at 50 parts per million (ppm) or less as compared with salt added at 2% (20,000 ppm).
- Microtracers® are added to feeds as a discrete inclusion. Results obtained are not confounded by background levels of amino acids, minerals or salt in feed.
- Microtracers can be used to detect extremely low levels of cross-contamination, by analyzing sequential samples.
- Microtracers® are included in the Standard of the American Society of Agricultural and Biological Engineers (ASABE) (USA) and in the GMP+ Test Methods (Holland).
The four steps to validate mixer performance using Microtracers® are:-
- Addition of the Microtracer® to the feed
- Sampling the feed after mixing
- Analyzing the feed samples for the Microtracer®
- Interpreting data
1) Addition of the Microtracer® to the Feed
The most common analytical procedure uses Microtracers® F. comprising 25,000 particles/gram. This Microtracer® is added to the trial feed at 50 grams per 2,000-lbs of feed or bulk feed premix to yield an expected 103 particles/colored spots from analysis of 75 gram subsamples.
The Microtracer® should be mixed in the proportion of 1 part tracer with 9 parts of extender such as limestone powder to simulate commercial practice where critical micro ingredients such as vitamins, minerals or drugs are added to a feed as a premix.
The Microtracer® premix should be added to the mixer at the same position and time that other micro ingredients are added -- whether by hand or from an automated microbin.
For paddle mixers, two different colored Microtracer® F products should be added with one at each end of the mixer. This allows validation of end-to-end distribution of the tracer in the mixer.
Two or even three mixing times can be validated in one test batch by adding different colors of tracer sequentially into the batch.
For example Microtracer F-Blue could be added at the time the mixer is fully loaded; Microtracer F-Red after one minute and Microtracer F -Orange after two minutes. Then the mixer could be left to mix for an additional minute. For the samples taken, the Blue tracer will have mixed 3 minutes, the Red for 2 minutes and the Orange for one minute.
2) Sampling Feed After Mixing
The location of sampling depends on the purpose of the trial.
- To validate performance of the mixer, samples are obtained from within the mixer at different locations and depths.
- To evaluate the mixing quality of the feed or premix at the point of transfer from the mixer, samples should be taken at the point of discharge.
- To evaluate the mixing quality of the feed or premix prior to delivery, samples can be obtained directly from the vehicle discharge auger or from bags of feed.
Variability in mixing usually increases after discharge from the mixer science feed with tracer may commingle with feed not containing the tracer as cross contamination from prior batches of feed or premix may occur.
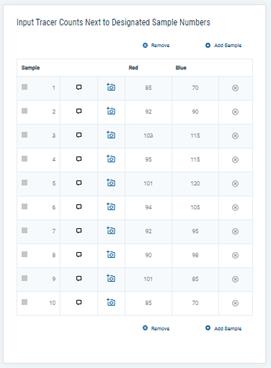
A minimum of ten samples is recommended per batch. All samples must be discrete (not composites) and they should not be mixed prior to analysis since this reduces the power of the test. Tracer counts should be obtained from 75 g. units of feed not 200 g. units. A minimum of 200g per sample is recommended to permit retests if required.
In taking samples, safety must be the highest priority. It may be necessary to shut off power to a mixer if samples are taken from within a mixer or to a screw conveyer when samples are taken from the screw conveyer. Hands must never be placed between the conveyer screws even if power is shut off.
3) Analyzing the Microtracer® in Feed
The analytical procedure is summarized below:-
- Lift the subsample from the top of the sample bag and weigh it in a weigh scoop or dish on a laboratory scale (75 suggested).
- Pour the sample through the upper hopper of a “Rotary Detector” laboratory magnetic separator to isolate the tracer on a sheet of filter paper resting over the rotating magnet.
- Brush the magnetically retrieved material including Microtracer® into a small aluminum weigh scoop and use a bulk tape eraser to “demagnetize” the material.
- Sprinkle the retrieved material onto a large, 7 inch (18cm) diameter filter paper and use an artist's fan-shaped brush to disperse the tracer evenly on the test paper.
- Use a polyethylene spray bottle with special head to “mist” the developing solution of 50% ethyl alcohol over the surface of the filter paper. As soon as colored spots begin to develop, transfer the test paper to a pre-heated hot plate or oven to dry the paper and “fix” the spots.
- Determine the number of spots by eye using a hand-held counter or use a Microtracer® spot-counting app. (free download for Android and iOS devices).
The Microtracer® “Rotary Detector” and peripherals including “bulk tape eraser”, hot plates, grinder (to reduce feed pellets to mash for analysis), filter paper as well as Microtracers® F can be purchased form Micro-Tracers, Inc., San Francisco.
A video of the rotary detector analytical procedure can be found at this link.
4) Interpreting Data
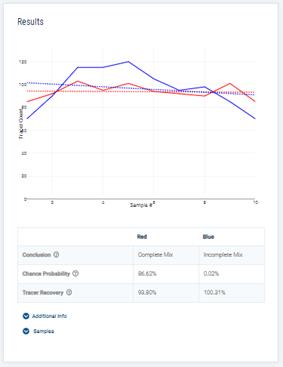
Microtracer® F particles yield colored spots that are counted as described above. Comparison of values is governed by Poisson particle statistics and the Chi-Squared test rather than percentage Coefficient of Variation (CV%) .
Click here for more information on the statistical interpretation of Microtracers® results.
Data is entered into either the Microtracer® Web Portal or App. (data input into one will sync to the other). The Portal or App will then calculate all statistics and provide a determination whether the mix is complete.
Completeness of a mix is determined by applying the Chi-Square test, which yields a “Chance Probability” or likelihood. If the chance probability denoted by the trial data is greater than 5%, the result is evidence of a complete mix because any excess variability is insufficient to be “statistically significant.” Results with chance probabilities between 1% and 5% are considered “Probably Incomplete” and with Chance Probabilities less than 1% mixes are considered as “Incomplete”.
Individual data points may only be discarded for good reason, as with first and last samples. For example, if the graphed values show significantly lower tracer recovery in the first and last sample taken from the mixer discharge, it may be concluded that cross contamination from prior batches of feed or premix occurred. By omitting those values, it can be determined that the intermediate samples were adequately mixed.
Conclusion
Microtracers® assay is the method of choice for validating feed mixing. The procedure can be performed on-site by mill personnel, rapidly providing valuable information at low cost. Free software, data interpretation, and support are provided by Micro-Tracers Inc. San Francisco.
Additional Comments
- International Applications of Microtracer® Assays
Several types of Microtracers® are used to meet requirements of specific markets. In many European countries, feed manufacturers are required to attain a CV of 5% for trial results by counting tracer particles/colored spots, with the tracer added to feeds at 10 grams/metric tonne (10ppm). Special Microtracers® and methods developed by Micro-Tracers Services Europe (MTSE-Germany) have been developed to achieve these requirements.
In France, feed manufacturers achieve a CV of 5% in assays by using Microtracers RF (colored iron powder), and reading the color using a spectrophotometer applying methods developed by Tecaliman- the French Feed Research Institute.
In the USA and most of the world, feed manufacturers use Microtracers F (colored iron particles) with results interpreted using the applicable Poisson statistics and the Pearson Chi-Squared test.
- Reproducibility of Microtracer® Mixer Assays and Determining Cross-Contamination.
Since using Microtracers® to validate mixers is rapid and inexpensive it is possible to take large numbers of samples to evaluate a variety of parameters including mixing time, batch size, particle size of feed. Replication of data is possible using Microtracers® contributing to inexpensive, rapid and accurate evaluation of mixing accuracy.
Cross contamination can be easily determined by assaying for the Microtracer® in subsequent batches of feed in which the tracer was not added. Analyzing larger samples from these batches will increase the sensitivity of the test. For example, by analyzing 400g samples instead of the suggested 80g, a particle count of 500 would be expected if Microtracer were added at 50 grams/tonne. The proportion of cross contamination will be indicated by the actual number of particles determined divided by 500. If 25 particles were found, the cross contamination percentage would be estimated at 25/500 = 5%.
|
L-Selenomethionine, Key Component of a Selenized Yeast Feed Additive
|
03/10/2020 |
|
 Dr. Brecht Bruneel, Technical Manager, Orffa Additives BV. Dr. Brecht Bruneel, Technical Manager, Orffa Additives BV.
Modern genetics has resulted in chickens characterised by high performance. The downside of this success is the high sensitivity to numerous stresses. To allow the animal the chance to respond adequately to these stresses, selenium (Se) is added to the diet. As an essential trace element, selenium is required for optimal performance, reproduction and immunity. Specific enzymes (selenoproteins) require the incorporation of Se to ensure their activity in the animal. These enzymes reduce the presence of reactive oxygen species, produced during normal metabolic activity and are elevated during stress causing cell damage and subsequent malfunction of tissues. Protection against these harmful metabolites is especially important in high energy-demanding cells.
The new divide: L-selenomethionine compared to all other selenium compounds
Se can be added to the diet as L-selenomethionine or as sodium selenite, sodium selenate, selenocysteine or organic selenium intermediates. The advantage of selenium in the form of L-selenomethionine (L-SeMet) over all other selenium compounds is the ability to be incorporated directly into animal proteins. This metabolically active Se acts as a storage depot for Se within tissues (Figure 1). Other Se compounds are invariably reduced to hydrogen selenide (H2Se) and subsequently converted to de novo selenocysteine and incorporated into selenoproteins. Hydrogen selenide does not function as a reserve for Se in tissues and cells and any excess is excreted via methylation in the liver to prevent toxic reactions.
L-SeMet, is the only Se compound that can be directly, without conversion, incorporated into structural proteins in muscle and liver tissue. This storage ensures optimal Se supply, even during stress such as heat exposure when dietary intake of Se can be limited. Under stress conditions there is a high demand for Se to inactivate oxygen free radicals and reduce cell damage. Research has shown that Se from sodium selenite is excreted at a rate almost three-fold more than Se from L-SeMet when fed to broilers, confirming that inorganic Se is not stored (Skrivan et al. 2008).
L-SeMet is generally supplied in diets by addition of selenized yeast. Yeasts have limited ability to incorporate Se in the form of L-SeMet, (Schrauzer, 2006). Normally, around 63% of the total Se in a selenized yeast is present as L-SeMet but there is a large variation among products and batches (Figure 2). L-SeMet incorporated in yeast protein is also not completely bioavailable as it has to be digested before it can be absorbed. (Sauvant,2004). Other selenium sources present in yeast cells follow the pathway to hydrogen selenide and are therefore not any more valuable as a Se source than inexpensive inorganic Se. From an efficiency point of view, selenized yeast does not provide the full potential of L-selenomethionine. Pure synthetic preparations of L-selenomethionine, contributing selenium as a single amino acid is the most bioavailable form.
The benefits of L-selenomethionine in poultry
Frequent stressful periods are always correlated with an increased metabolic activity and energy demand that is correlated with a period of high oxidative stress. To combat this stress the animal requires proportionately higher levels of Se. The literature confirms that heat- stressed chick embryos benefit from maternal Se in the form of L-SeMet compared to inorganic Se (Xiao et al. 2016). A significant increase in selenoprotein synthesis including glutathione peroxidase occurs with a resulting reduction in reactive oxygen species (ROS) and malondialdehyde, a biomarker for lipid peroxidation. L-SeMet is beneficial in improving the antioxidant response of chick embryos as it is transferred efficiently and to a high extent from the diet to the egg. When comparing sodium selenite, selenized yeast and L-SeMet in deposition of Se in the egg, the L-SeMet was able to increase the Se content in the egg to the highest level among alternative sources (Delezie et al. 2014).
L-SeMet is not only able to adequately respond to heat stress in embryos, but also in broilers as it the compound is stored efficiently in muscle tissue as a component of muscle proteins. When broilers were subjected to chronic heat stress during the finisher period, feeding L-SeMet improved weight gain and enhanced the efficiency of feed conversion (Michiels et al. 2016).
After slaughter L-SeMet has a positive effect on meat quality. Chick tissue is especially vulnerable to oxidative stress expressed as lipid peroxidation due to the presence of long-chain polyunsaturated fatty acids (PUFA). L-SeMet not only reduces lipid peroxidation but also increases the alpha-tocopherol (vitamin E) content due to inherent regenerative ability that is more efficient than sodium selenite (Skrivan et al. 2008). Studies have demonstrated a reduction in drip loss of almost one percent after storage of the meat for 48 hours when diets were supplemented with L-SeMet compared to sodium selenite (Zhang et al. 2014).
Replacement of sodium selenite by L-selenomethionine in broiler breeder diets has demonstrated benefits on fertility, hatchability and viability of chicks after hatching. As L-SeMet is efficiently transferred from the diet to the egg for the developing embryo it helps the young chick to overcome incubation and hatch-related stress. A long-lasting maternal effect, persisting to slaughter, has also been observed from L-SeMet supplementation (Wang et al. 2011, Zhang et al. 2014).
Positive effects on eggshell quality, production and freshness have also been observed by supplementing the diets of laying hens with L-SeMet.
Achieving maximum potential
L-selenomethionine has long-standing proven benefits over all other selenium compounds including sodium selenite, sodium selenate, selenocysteine and organic selenium intermediates under conditions of stress. selenium has been lifted to its maximum potential.
Excential Selenium 4000 (Orffa Additives BV,) is the only organic product in the market providing selenium in the most effective, bioavailable form as L-selenomethionine. The product is consistent in concentration and biological activity compared to other organic selenium sources such as selenized yeast. Excential Selenium 4000 is an organic source of Se compliant with worker safety due to the absence of dust.
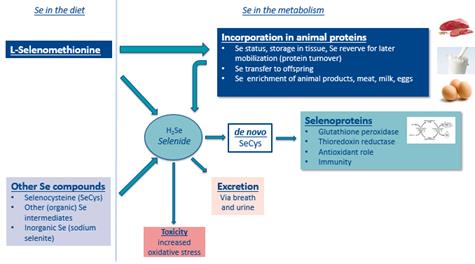
Figure 1: The metabolism of L-selenomethionine and other selenium compounds (adapted from Rayman, 2004; and Combs, 2001).
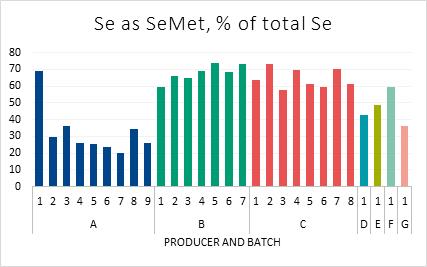
Figure 2: Commercial sample review of selenized yeasts (n=28) from seven producers (Rovers, 2015)
References:
Combs, G.F. 2001. Selenium in global food systems. British Journal of Nutrition, 85:517-547
Delezie, E., Rovers, M., Aa Van der, A., Ruttens, A., Wittocx, S., Segers, L. (2014). Comparing responses to different selenium sources and dosages in laying hens. Poultry Science, 93:3083-3090.
Michiels, J., Degroote, J., Majdeddin, M., Golian, A., De Smet, S., Rovers, M., Segers, L. (2016) Effect of L-Selenomethionine supplementation during stress periods of starter broilers and chronic cyclic heat stressed finishing broilers. Proc. 25th WPC, Sept 5-9, China
Rayman, M.P. 2004. The use of high-selenium yeast to raise selenium status: how does it measure up? British Journal of Nutrition, 92:557-573
Rovers, M. (2015) Organic selenium is all about selenomethionine. All About Feed, 23(8):8-10
Sauvant, D., Perez, J.M., Tran, G. (2004) Tables of composition and nutritional value of feed materials. INRA, pages 220-221
Schrauzer, G.N. (2006) Selenium yeast: Composition, quality, analysis, and safety. Pure Appl. Chem., 78(1):105-109
Skrivan, M., Dlouhá, G., Mašata, O., Ševcikova, S. (2008) Effect of dietary selenium on lipid oxidation, selenium and vitamin E content in the meat of broiler chickens. Czech J. Animal. Sci., 53(7):306-311
Wang, Y., Zhan, X., Yuan, D., Zhang, X., Wu, R. (2011) Influence of dietary selenomethionine supplementation on performance and selenium status of broiler breeders and their subsequent progeny. Biol. Trace Elem. Res., 143:1497-1507
Xiao, X., Yuan, D., Wang, Y., Zhan, X. (2016) The protective effects of different sources of maternal selenium on oxidative stressed chick embryo liver. Biol. Trace Elem. Res., 172:201-208
Zhang, L., Wang, Y.X., Zhou, Y., Zheng, L., Zhan, X.A., Pu, Q.H. (2014) Different sources of maternal selenium affect selenium retention, antioxidant status, and meat quality of 56-day-old offspring of broiler breeders. Poultry Science, 93:2210-2219
|
|
|
|
View Current
|
Top
|
|