USDA Weekly Egg Price and Inventory Report, May 1st 2024.
Market Overview
- The average wholesale unit revenue values for Midwest Extra-large and Large sizes were down 16.2 percent this past week. Medium size was down 16.5 percent. National wholesale price for large in cartons at $2.50 per dozen was approximately $0.95 per dozen above the 3-year average of $1.55 per dozen and up $1.05 from the corresponding week in 2023 at $1.45 per dozen. This past week shell egg inventory was up by 0.8 percent, moderating a rise of 1.5 percent in stock the previous week.
- Although there has been a weekly increase in pullet flocks transferred to laying houses, hen numbers are constrained by the loss of close to 13 million hens due to HPAI on twelve complexes holding from 250,000 to 2.6 million hens during the 4th Quarter of 2023. Pullets are in short supply with losses of 2.5 million growing birds, mainly in California. Since the beginning of April close to 8.4 million hens collectively have been depopulated in a sequence comprising one complex in Texas and three related facilities under common ownership in Michigan in addition to a breeder complex in New Mexico.
- This past week chains apparently narrowed the spread between delivered cost and shelf price. This could result in a continued reduction in generic stock with a proportional rise in demand but only with constant re-ordering to fill the pipeline through May. Discounters are holding prices on generics influencing mainstream retail stores. Eggs are still highly competitive in price against the comparable costs for other protein foods.
- Total industry inventory was up by 2.8 percent overall this past week to 1.69 million cases with a concurrent 11.5 percent increase in breaking stock, following a 0.2 percent increase during the preceding processing week. Demand for egg products has fallen into May attributed to less home-baking and entertaining. Egg products are required for the food service and manufacturing sectors and for exports that increased in February.
- It is now apparent that the inventory held by chains and other significant distributors may be more important over the short term in establishing wholesale price compared to the USDA regional inventory figures. Changes in stock held by DCs and in the pipeline as determined by weekly orders are probably responsible for small cyclic fluctuation in weekly industry stock, especially into and after a holiday weekend.
 |
- Cases of HPAI in the commercial poultry industry and backyard (non-commercial WOAH) flocks tapered during the first quarter of 2024, coincident with the end of the Fall migration of waterfowl that was extended into late 2023 by mild weather. The emergence of the infection in a large complex with 2 million birds in western Texas suggested a reoccurrence of the epornitic as northward spring migration has commenced. The three subsequent related cases in Michigan involving a total of 6.4 million hens may have commenced as an indirect extension from an infected dairy herd although an epidemiologic evaluation in progress will be required to confirm the source and routes of intra-Company dissemination. The number and extent of future possible outbreaks during the spring and fall months of 2024 cannot be projected but sporadic cases in backyard poultry and close to 40 dairy herds in nine widely diverse states is a cause for concern. More surveillance information should be released by USDA-APHIS as it becomes available concerning the prevalence rate of carriers among resident domestic free-living birds and a review of molecular and field epidemiology for the 2022 spring and fall waves of HPAI. The USDA has yet to identify and release specific modes of transmission for the 2022-2023 epornitic including likely airborne spread from wild birds and their excreta over short distances.
- The current relationship between producers and chain buyers based on a single commercial price discovery system constitutes an impediment to a free market. The benchmark price appears to amplify both downward and upward swings as evidenced over the past two years. A CME quotation based on Midwest Large, reflecting demand relative to supply would be more equitable. If feed cost is determined by CME ingredient prices then generic shell eggs should be subject to a Midwest Large quotation.
- According to the USDA the U.S. flock in production was apparently down by 0.4 million hens (0.1 percent) to a new level of 306.6 million for the week ending May 1st The stated total flock of 311.9 million included about one million molted hens that will resume lay during coming weeks plus 4.5 to 5.0 million pullets scheduled to attain production. Given the latest figures it is estimated that the producing flock is at least 17 to 20 million hens lower than before the onset of HPAI in 2022. In January 2024 the USDA adjusted figures to account for depopulation of 13 million hens spread over the last quarter of 2023. There were evident discrepancies between published figures and the theoretical number of hens over successive weeks taking into account known losses and predetermined pullet replacements. The April loss of 8.4 million hens is not reflected in data released over the past four weeks. It is hoped that the USDA agency responsible for publication of flock size will get their act together and coordinate with APHIS to record the number of depleted flocks and promptly provide accurate data. Figures released on May 1st overestimate flock size
- The ex-farm price for breaking stock (rounded to one cent) was down 14.9 percent to $1.34 per dozen.Checks delivered to Midwest plants were down 18.2 percent to $1.17 per dozen this past week. Prices for breaking stock should follow the wholesale price for shell eggs usually with a lag of about one to two weeks.
The Week in Review
Prices
According to the USDA Egg Market News Reports released on April 29th 2024, the Midwest wholesale price (rounded to one cent) for Extra-large was down 16.1 percent from last week to $2.04 per dozen. Large was down 16.2 percent to $2.02 per dozen. Mediums were down 16.5 percent to $1.92 per dozen delivered to DCs. Prices should be compared to the USDA benchmark average 4-Region blended nest-run cost of 75.3 cents per dozen as determined by the Egg Industry Center based on USDA data for March 2024. This value excludes provisions for packing, packaging materials and transport, amounting to 57 cents per dozen as determined in mid-2023 from an EIC survey (with a low response) and now realistically 60 cents per dozen.
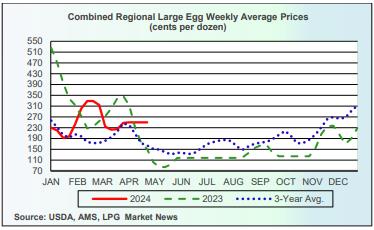
Currently producers of generic shell eggs should be operating with positive margins irrespective of region and customer-supply agreements. The progression of prices during 2023 and 2024 to date is depicted in the USDA chart reflecting three years of data, updated weekly.
 |
The April 29th edition of the USDA Egg Market News Report confirmed that the USDA Combined Region value (rounded to the nearest cent), was unchanged at $2.50 per dozen delivered to warehouses for the week ending April 26th 2024. This average price lags current benchmark Midwest weekly values by one week. The USDA Combined range for Large in the Midwest was $2.41 per dozen. At the high end of the range, the price in the South Central region attained $2.57 per dozen. The USDA Combined Price last week was approximately $0.95 per dozen above the 3-year average of $1.55 per dozen. This past week Midwest Large was approximately $1.05 per dozen above the corresponding week in 2023 that was falling from a peak price of $3.70 per dozen five weeks previously to $1.45 per dozen as production recovered from HPAI depletion but with declining market demand.
!More!
Flock Size
Previously the loss of approximately 13 million hens due to HPAI during the fourth quarter of 2023 was not reflected in weekly USDA figures until the beginning of February 2024. The loss of 8.4 million hens in April to date is NOT reflected in recent weekly data. Increases in flock size during late February and early March amounted to fractions of a percent. The USDA belatedly published data to reflect previous losses due to HPAI depopulation and molted flocks reentering production during the post-Easter period but has yet to update figures for substantial and known flock depletion in April. This is unacceptable given the importance of weekly flock numbers to pricing. Accurate values for the producing and total flocks are required by farmers and buyers.

According to the USDA the number of producing hens reflecting May 1st 2024 (rounded to 0.1 million) was apparently down 0.4 million to 306.6 million. The total U.S. flock includes about one million molted hens due to return to production Approximately 4.5 to 5.0 million pullets on average reach maturity each week, based on USDA monthly chick-hatch data for 20-weeks previously. The increase is offset by routine flock depletion and an additional loss of approximately 13 million hens during the last quarter of 2023. To date some flocks have been replaced but 8.4 million hens were depopulated April. Based on inventory level and prices, the population of hens producing table eggs and breaking stock should now be in excess of post-Easter demand by consumers. Industrial and food service off-take is increasing, approaching pre-COVID levels. Prices will continue to fluctuate but have shown atypical seasonal stability instead of a decline.
According to the USDA the total U.S. egg-flock on May 1st 2024 was stated to be down by 0.4 million hens to 311.9 million including second-cycle birds and those in molt. The almost constant weekly difference of 5.3 million hens between flocks in production and total hens is an approximate value but the accuracy of USDA figures is questioned. Data for the past week presumes that molted hens are resuming production consistent with current demand. Given the season and the trajectory in benchmark wholesale prices, only a few older flocks were molted or depleted during April. At present it is estimated that there are 17 to 19 million fewer hens in the total flock despite weekly USDA figures that have not included recent cases of HPAI. The apparent difference is equivalent to about 5.5 percent of the pre-HPAI 2022 national flock of 326 million hens.
INVENTORY LEVELS
Cold storage stock of frozen products in selected centers on April 29th 2024 was 2.349 million lbs. (1,067 metric tons), up 0.3 percent from an adjusted 2.357 million lbs. on April 1st 2024. The monthly USDA Cold Storage Report below quantified an increase in the actual total stock level at the end of March.
The most recent monthly USDA Cold Storage Report released on April 24th 2024 documented a total stock of 30.3 million pounds (13,780 metric tons) of frozen egg products on March 31st 2024. This quantity was up 24.4 percent from the March 21st 2023 value of 24.4 million pounds. March 31st 2024 frozen egg inventory was down 5.5 percent from the previous month ending February 29th 2024 attributed to presumably higher domestic demand and exports or their combination. Compared to March 31st 2023, the inventory of whites was up 29.9 percent to 3.15 million lbs. on March 31st 2024. Compared to March 31st 2023 yolk inventory was up 4.5 percent to 765,000 lbs. on March 31st 2024.
A total of 87.1 percent (26.4 million lbs.) of combined inventory comprised the categories of “Whole and Mixed” (40.9 percent) and “Unclassified” (46.2 percent). The lack of specificity in classification requires a more diligent approach to enumerating and reporting inventory by the USDA.
Shell Inventory
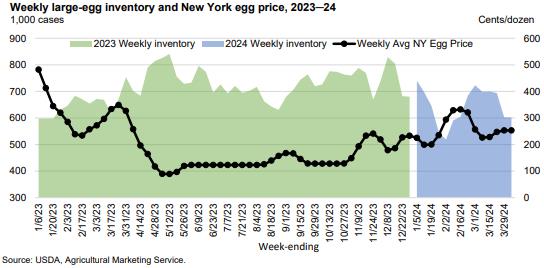
The USDA reported that the national stock of generic shell eggs effective April 29th 2024 was up 0.8 percent over the previous week. Inventory over the past week followed a rise 0f 1.3 percent the previous week confirming restoration of seasonal consumer demand in late April. Combined with breaking stock, the total inventory of shell eggs in industry cold rooms is now at a rounded level of 1.69 million cases rounded (1.64 million last week; 46,500 cases higher this week). The U.S. population of laying hens at this time is influenced by:-
- Losses following outbreaks of HPAI with the depopulation of over 13.0 million hens during the fourth quarter of 2023 and 8.4 million hens during April 2024.
- The population unaffected by HPAI.
- Flocks retained after molting with an anticipated increase in this category as influenced by prevailing wholesale egg prices, and indirectly responding to flock depopulation from HPAI.
- Started pullets from chick placements during mid November 2023. Going forward, younger hens will assume a larger proportion of the national flock as more flocks are placed compensating for the flocks depleted due to HPAI.
Three USDA Regions reported lower stock levels this past week. The six regions are listed in descending order of stock: -
- The Midwest Region was down 1.2 percent from the previous week to 424,400 cases.
- The Southeast Region was up 0.6 percent to 286,300 cases
- The South Central Region was up 5.8 percent to 265,400 cases
- The Southwest Region was up down 4.7 percent to 142,000 cases
- The Northeast Region was up 7.2 percent to 158,500 cases.
- The Northwest Region was down 6.4 percent to 64,900 cases
The total USDA six-area stock of commodity eggs comprised 1,686,100 cases (1,640,600 cases last week), up 2.8 percent, of which 79.6 percent were shell eggs (81.1 percent last week). The inventory of breaking stock was up 11.3 percent to 344,600 cases. Shell-egg inventory was up 0.8 percent attaining 1,341,500 cases. These changes are a function of regional shell-egg demand coupled with more regular re-stocking despite buyers apparently taking advantage of the industry benchmark price discovery system. Reoccurrence of HPAI will influence buyers who were previously unconcerned over short-term availability.
An inconsequential increase in inventory of breaking stock was recorded over the past week despite continued diversion to the shell egg market. Subsequent weekly stock levels of shell eggs will indicate the extent of industrial and consumer demand. Breaking is influenced by conversion to egg powder and liquids for export and by lower seasonal post-Easter demand for liquids by industry and food service. The average price for Midwest checks and breaking stock combined was 62.0 percent of the average value of Midwest Extra-large and Large shell eggs, consistent with proportionately lower prices for both shell eggs and breaking stock this past week. The differential of 62.0 percent can be compared to 80.0 percent in April 2022 reflecting the initial period of high demand for both shell eggs and products. This demonstrates the respective demands for shell eggs and egg products and the interconnectivity of the packing and breaking segments of the egg industry under circumstances of extreme disturbances in either supply (lower due to HPAI in 2022) or demand (higher during early COVID in 2020). The price for breaking stock and for checks is influenced by the relative demand for generic shell eggs and contract obligations with breakers.
On April 29th 2023 the inventory of other than generic eggs amounting to 458,100 cases (down 5.4 percent from last week at 484,400 cases) among three categories (with the previous week in parentheses) comprised: -
- Specialty category, down 14.8 percent to 36,500 cases with promotion. (was up 20.9% to 42,800 cases)
- Certified Organic, down 7.2 percent to 76,900 cases. (was down 7.2% to 82,800 cases)
- Cage-Free category, down 3.9 percent to 344,700 cases. (was down 3.9% to 358,800 cases)
Demand for cage-free product will not increase materially over the intermediate term while generic eggs from caged flocks and some surplus down-classified cage-free eggs are on the shelf at $2.40 to $2.60 per dozen during normal supply and demand conditions. Currently there is a small differential in shelf price between conventional caged eggs compared to cage-free white but a wider difference between higher priced omega-3 enriched, cage-free, free-range and pasture-housed products. That the higher priced egg categories will experience an erosion in demand as generic prices fall is supported by the findings of a comprehensive review relating to the transition from cages to alternative systems.*
Existing and proposed individual state legislation mandating sale of only cage-free eggs will support most of the completed and in-progress transition from cages but significant additional re-housing will not be completed by the beginning of 2025, less than 8 months away and clearly never, as projected by most industry observers. The constitutional status of Proposition #12 was confirmed by SCOTUS in a May 11th 2023 decision with specific reference to the dormant Commerce Clause relating to interstate trade. It is unlikely that a legislative initiative (the EATS Act) will be incorporated into the 2023 Farm Bill (that will be delayed beyond June 2024 or even early 2025 due to Committee deadlock and the November election), to limit the impact of Proposition #12 on sows housed for pork production. Many retail chains are ‘renEGGing’ on or extending their time commitments to achieve an acceptable transition to cage-free eggs despite coercion by animal welfare groups. The State of Utah is extending the deadline by five years. With the current proportion of non-caged flocks and lower prices for generic cage-derived eggs, cage-free eggs are surplus to demand in some areas. Organic eggs are subject to price pressure in many markets especially those served by club stores. Inventory of this category is holding solidly below 100,000 cases with this quantity representing the approximate production of three days of lay. Long-term demand for cage-free eggs will be influenced by the relative shelf prices of the category in comparison with generic white-shelled eggs from caged flocks. Inventory of this category is consistently above the 300,000-case benchmark over past weeks, but effectively is working stock given weekly production of 1.7 million cases per week. At the other end of the price range, consumers will purchase less-expensive brown cage-free product over organic eggs when there is a differential in price greater than about $1.20 per dozen under normal conditions of supply and demand. Similarly, consumers will traditionally purchase white-shelled generic eggs in preference to white or brown-shelled cage-free with a differential of over $1.20 per dozen.
A comprehensive structured market research project on cage-free eggs has provided an indication of consumer willingness to pay for this attribute. The industry requires a study on other aspects including shell color, GM status and nutritional enrichment using conjoint analysis. Above all, agricultural economists should evaluate the impact of disruption in supply and demand arising from large-scale depopulation following the 2015 and 2022-2024 HPAI epornitics including the current wave of outbreaks.
*Caputo,V. et al The Transition to Cage-Free Eggs. February 2023
RELATIVE PRICES OF SHELL-EGG CATEGORIES
USDA-AMS posted the following national shell egg prices as available, for April 26th 2024 for the preceding week in the Egg Markets Overview report representing dozen cartons with comparable prices in parentheses for the previous week: -
Retail Prices
Large, in cartons generic white: $1.50 Up 11.3 percent ($1.33)
Large, in cartons cage-free brown: $3.34 Unchanged ($3.50)
Wholesale
Midwest in cartons $2.42 Unchanged ($2.42)
Large C-F, California in Cartons: $3.02 Unchanged ($3.02)
National loose, (FOB dock): $1.42 Down 24.1 percent ($1.87)
NYC in cartons to retailer: $2.01 Down 20.0 percent ($2.54)
Regional in cartons to warehouse reported April 26thfor previous week.
Midwest $2.41 Unchanged ($2.41)
Northeast $2.46 Unchanged ($2.46)
Southeast $2.55 Unchanged ($2.55)
South Central $2.57 Unchanged ($2.57)
Combined $2.50 Unchanged ($2.50)
WEEKLY ADVERTISED PRICES OF SHELL-EGG CATEGORIES W/E May 2nd.
USDA Certified Organic, Brown, Large: $5.19 ($3.92)
Cage-Free Brown, Large: $3.42 ($3.38)
Omega-3 Enriched Specialty, White, Large: $2.47 ($2.67)
Generic White, Large Grade A $1.49 ($1.33)
The advertised price for Large white grade A as featured for the week ending May 2nd at $1.49 per dozen, (985 stores) down $0.16 or 12.0 percent below $1.33 per dozen last week. Current supply is probably below retail demand given the slightly higher inventory held by the industry as reported by the USDA. Independent producers continue to divert shell eggs from breaking to the higher-priced shell market. Integrated companies and packers continued to deliver to DCs and this week chains increased orders to rebuild levels in DCs and stores to meet demand with a stable benchmark price. Over the past two weeks wholesale price has remained steady without demonstrating a typical post-Easter decline.
The USDA benchmark-advertised retail price for certified organic for the week was $5.19 per dozen, (583 stores), up $1.27 per dozen (32.4 percent) percent from the USDA price of $3.92 per dozen posted last week. A USDA advertised price of $3.42 per dozen was posted for cage-free brown during the past week (979 stores), up $0.04 per dozen or1.2 percent from last week at $3.38 per dozen. The price differential between USDA organic and cage-free brown amounting to $1.77 per dozen will result in demand for cage-free brown over certified organic eggs. Week-over-week single digit fluctuations expressed as a percentage can be expected in the stock of specialty and organic eggs based on the small base of these categories. There was a moderate upward movement in the inventory of cage-free this past week consistent with decreased demand for this category.
Cage-free brown at $3.42 per dozen was $0.13 per dozen (3.7 percent) lower than cage-free white at $3.55 per dozen (354 stores).
Certified organic was promoted this past week at 21.3 percent of the total, despite lower inventory, (last week 20.8 percent of features). Omega-3 enriched comprised 10.4 percent of features with substantially lower inventory (39.0 percent last week). Cage-free was at 39.2 percent with slightly lower stock (50.8 percent last week). This past week Large size comprised 29.0 percent of features up from 1.7 percent and the only generic size promoted.
USDA Cage-Free Data
According to the latest monthly USDA Cage-free Hen Report released on May 1st 2024, the number of certified organic hens in April was down 8.2 percent from March 2024 at 16.7 million, (rounded to 0.1 million) following depopulation due to HPAI.
The USDA reported that the cage-free (non-organic) flock in March 2024 was down 6.8 percent from March 2024 to 99.2 million, (rounded to 0.1 million).
According to the USDA the population of hens producing cage-free and certified organic eggs in April 2024 comprised: -
Total U.S. flock held for USDA Certified Organic production = 16.7 million (18.3 million in Q1 2024).
Total U.S. flock held for cage-free production = 99.2 million (105.7 million in Q1 2024).
Total U.S. non-caged flock =115.9 million (124.0 million in Q1 2024).
This total value represents 35.5 percent (March, 38.3 percent) of a nominal 326 million total U.S. flock pre-HPAI in 2022 (but 38.6 percent of the national flock after HPAI mortality to a presumed complement of 300 million in production). Hens certified under the USDA Organic program have decreased in proportion to cage-free flocks since Q1 of 2021.
The accuracy of individual monthly values was previously questioned given a history of either constant numbers or a sharp change in successive months as documented over the past two years. The values in the May 1st Cage-Free report reflect depopulation during April. It is anticipated that the June release will reflect a realistic number of producing hens housed cage-free during May 2024. Precise quarterly reports would be more suitable for the industry in planning expansion and allocation of capital than inaccurate monthly values.
Processed Eggs
For the processing week ending April 27th 2024 the quantity of eggs processed under FSIS inspection during the week as reported on May 1st 2024 was down 1.1 percent compared to the previous processing week to a level of 1,470,094 cases, (1,486,047 cases last week). The proportion of eggs broken by in-line complexes was 54.8 percent with slightly more diversion to higher-priced shell markets by uncommitted producers, (53.3 percent in-line for the previous week). The differential in price for shell sales and breaking will determine the movement of uncommitted eggs. This past week 70.4 percent of egg production was directed to the shell market, (70.2 percent for the previous week), responding to the differential in prices paid by breakers and packers. Breaking stock inventory was up 11.3 percent this past week to 344,600 cases. Apparent demand from QSRs and casual dining is at stable to slightly lower levels. There is ongoing demand from baking and eat-at-home despite the weekly fluctuation in the inventory of breaking stock. During the corresponding processing week in 2023 in-line breakers processed 51.1 percent of eggs broken.
For the most recent monthly report reflecting March 2024, yield from 5,611,714 cases (5,462,517 cases in February) denoted a decrease in demand for liquid and diversion to shell egg sales over the period March 3rd 2024 through March 30th 2024. Edible yield was 39.1 percent, distributed in the following proportions expressed as percentages: liquid whole, 61.2; white, 24.0; yolk, 12.3; dried, 2.5.
All eggs broken during 2023 attained 69.78 million cases, 8.4 percent less than 2022. Eggs broken in 2024 to date amounted to 23.94 million cases, 2.5 percent less than the corresponding period in 2023. This is attributed to moderately increased demand for egg liquids from retail, food service and QSRs and casual dining restaurants. Consumers are constrained by economic uncertainty following the ending of COVID support, moderate inflation, high credit card interest rates,. Mortgage repayments and a tendency to purchase only essentials.
PRODUCTION AND PRICES
Breaking Stock
The average rounded price for breaking stock was down 14.9 percent this past week to $1.34 per dozen with a range of $1.25 to $1.34 per dozen delivered to Central States plants on April 29th. The price of checks was down 18.2 percent this past week at an average of $1.17 per dozen over the most frequent range of $1.16 to $1.18 per dozen suggesting that the market for breaking stock follows prices for shell eggs following pronounced up or down swings.
Shell Eggs
The USDA Egg Market News Report dated April 29th 2024 confirmed that Midwest wholesale prices for Extra-large and Large were down 16.1 percent and Medium size down 16.5 percent from the previous week. A slightly higher inventory combined with a weekly reduction in benchmark price, suggests that the market is operating with reduced demand. The following table lists the “most frequent” ranges of values as delivered to warehouses*:-
|
Size/Type
|
Current Week
|
Previous Week
|
|
Extra Large
|
202-205 cents per dozen
|
241-244 down 16.1%
|
|
Large
|
200-203 cents per dozen
|
239-242 down 16.2%
|
|
Medium
|
190-193 cents per dozen
|
228-231 down 16.5%
|
|
Processing:-
|
|
|
|
Breaking stock
|
125-143 cents per dozen
|
155-160 down 14.9%
|
|
Checks
|
116-118 cents per dozen
|
142-144 down 18.2%
|
*Store Delivery approximately 5 cents per dozen more than warehouse price
The April 29th 2024 Midwest Regional (IA, WI, MN.) average FOB producer price, for nest-run, grade-quality white shelled Large size eggs, with prices in rounded cents per dozen was down 24.6 percent from last week, (with the previous week in parentheses): -
- $1.71 ($2.25), (estimated by proportion): L. $1.69 ($2.22): M. $1.57 ($2.09)
The April 29th 2024 California negotiated price per dozen for cage-free, certified Proposition #12 compliant Large size in cartons delivered to a DC, (with the previous week in parentheses) was down 11.3 percent from last week, despite depopulation of a third of the laying hens in the state but offset by introduction from Midwest and Southwest supplying states.
- $2.70 ($3.04); L. $2.68 ($3.02); M. $2.55 ($2.87)
Shell-Egg Demand Indicator
The USDA-AMS Shell Egg Demand Indicator reported on April 24th 2024 was down 0.9 points from the last weekly report to -2.1 with a 2.8 percent increase in total inventory and a 0.8 percent higher shell inventory from the past week as determined by the USDA-ERS as follows: -
|
Productive flock
|
306,618,868 million hens* (down 0.1%)
|
|
Average hen week production
|
83.3%(was 82.6%)
|
|
Average egg production
|
255,338,469 per day (down 0.3%)
|
|
Proportion to shell egg market
|
70.4% (was 70.2%)
|
|
Total for in-shell consumption
|
499,260 cases per day (up <0.1%)
|
|
USDA Table-egg inventory
|
1,341,500 cases (up 0.8%)
|
|
26-week rolling average inventory
|
4.24 days
|
|
Actual inventory on hand
|
4.33 days
|
|
Shell Egg Demand Indicator
|
-2.1 points (was -1.2 on April 24th 2024)
|
*An unrealistically high figure attributed to failure by the USDA to adjust flock size following HPAI depletions in TX and MI
The USDA Monthly Report covering March 2024 production including text, tables, data and prices and the 3rd Quarter results for Cal-Maine Foods can be accessed under the STATISTICS tab
Dried Egg Products
The USDA extreme range in prices for dried albumen and yolk products in $ per lb. was released on April 26th 2024. Data for yolk and whole egg powder over the past week was available from the USDA. Values are depicted for the previous week and in parentheses for the week before that. Values for past months illustrate the trend in prices influenced by HPAI depopulation and subsequent repopulation:-
|
Whole Egg
|
$4.80 to $6.50
($5.00 to $6.50)
|
Average
Dec. $ 5.63
Jan. $ 5.40
Feb. $ 5.40
March $ 5.85
April $ 5.80
|
|
Yolk
|
$3.70 to $5.30
($4.00 to $5.70)
|
Average
Dec. $ 4.55
Jan. $ 4.49
Feb. $ 4.85
March $ 4.71
April $ 4.76
|
|
Spray-dried white
|
No quotation, past week
|
Average Dec ‘22. $14.18
Jan. $14.18
Feb. onwards ’24 No release
|
|
Blends
|
No quotation, past week
|
|
Frozen Egg Products
The USDA posted the range in prices for frozen egg products for the past week. Prices in cents per lb. based on the extreme range on April 26th 2024 compared to the previous week showed fluctuation in price:-
|
Whole Egg
|
$1.23 - $1.34
|
$1.32 - $1.37
|
|
White1
|
$1.11 - $1.14
|
$1.11 - $1.14
|
|
Average for Yolks
|
$2.04 - $2.11
|
$2.03 - $2.08
|
- extreme range
Whole egg: Down 4.5%. Whites: Unchanged and Yolks: Up 1.0%.
This indicated a relatively stable demand for whites and yolks but lower demand for whole egg from the manufacturing and food service sectors and for export.
April averages (March): Whole. $1.39, ($1.36); Whites, $1.25, ($1.21); Yolks, $2.13, ($2.00).
Liquid Egg Products
Values for Whites and Yolks covering non-certified truckload quantities have been released at irregular intervals over past weeks. Whole egg values attained on average 108 cents per lb. last week. April averages (cents per lb.) are compared with March values (in parentheses): -
Whole, $1.11, ($1.11); Whites, $0.87 ($0.85); Yolks, $1.75, ($1.77).
The USDA has not released a report on dried egg inventory since March 13th 2020 due to inability to obtain data from producers, and will not issue reports for the immediate future.
COMMENTS
During the 4th quarter of 2023 and extending into January 2024, outbreaks of HPAI required depopulation of close to 13 million egg-producing hens. In contrast to 2022, more broiler flocks were affected in 2023 with cases in California and Arkansas during the fall of 2023. Subsequent cases occurred in Nebraska. An incident outbreak of HPAI in turkeys occurred in MN during April after a quiescent period with the previous cases in NC and MO in January and February respectively. There are still incident cases recorded in backyard flocks and presumably free-living predatory birds and in scavenging carnivorous mammals. The infection has now been recognized as bovine influenza-H5N1 in 37 diagnosed dairy herds in nine states. Losses in hens (TX, 2 million and MI, 6.4 million) were confirmed during April. Given the risks and consequences of infection it will be necessary to continue to maintain high levels of structural and operational biosecurity with intensification persisting through the remainder of Spring months. Outbreaks in commercial flocks appear to be correlated with shedding of AI virus by migratory birds that moved southward late driven by sharply colder weather in January. Northward migration has commenced and additional outbreaks can be anticipated
Approximate losses in commercial flocks confirmed with HPAI and updates during the 2022/3 phases of the ongoing epornitic included:-
- 6,900,000 broilers on 28 farms in 8 states during 2002 - 2023
- 330,000 broiler breeders on 11 farms in 6 states.
- 360,000 upland game birds October through December 2023.
- 14,100,000 turkeys including breeder flocks in 8 states during 2022 and through 2023 year-to-date. During the past nine weeks losses have approximated 2.9 million growing turkeys with 63 incident cases confirmed in seven states (SD; ND; UT; MN; IA; WI, MI.).
- 52,300,000 egg-production hens in total with 95 percent on 37 large complexes above 0.5 million in addition to 3,500,000 pullets with a total of 54 locations in 12 states. Pullet mortality does not include “at risk” replacements depleted on affected complexes with contiguous pullet rearing. During the fourth quarter of 2023 more than 13.0 million hens have been depopulated in 13 outbreaks.
Losses due to HPAI reported by USDA during the week ending April 26th (the USDA is about a week late in posting) comprised one WOAH non-poultry flock (ID.). During the past week two turkey flocks were depopulated in MI. Three breeder units (type unspecified) holding 128,000 birds were diagnosed in in New Mexico.
Backyard flocks (non-WOAH) allowed outside access will continue to be at risk of infection in the U.S. These small clusters of birds in both suburban and rural areas are of minimal significance to the epidemiology of avian influenza as it affects the commercial industry. Backyard flocks serve as indicators of the presence of virus among free-living birds as evidenced by ongoing outbreaks in commercial poultry flocks across the U.S. The late 2023-early 2024 epornitic evidently had a long tail. Recent outbreaks in backyard flocks especially in northern tier states suggest shedding by resident, non-migratory free-living birds that may have become reservoirs. This has implications for seasonality
The USDA-APHIS published a report on the results of epidemiologic studies* on farms in early 2022 and made available on July 25th. Results for 18 egg-production case farms and 22 control farms suggested higher risk of infection associated with the presence of a farm in a control zone, proximity of wild birds, mowing or bush hogging of vegetation adjacent to the farm, and off-site disposal of routine mortality. These factors suggest possible aerogenous introduction of virus shed by wild birds onto farms over short distances. This presumption is based on anacdotal observations and recent published research from Taiwan demonstrating avian influenza virus in air in proximity to migratory birds. A paper on wind-borne dissemination of HPAI during the 2003 epornitic was published in 2012. The preliminary USDA study predictably suggested that protection was enhanced by effective structural and operational biosecurity. The validity of findings was limited by the confounding inherent to the diversity in size of flocks incorporated into the case-control study and deriving data from a 26 page questionnaire by telephone survey, months after outbreaks, introducing recollection bias and responder fatigue.
*Green, A. et al Investigation of risk factors for introduction of highly pathogenic avian influenza H5N1 virus onto table egg farms in the United States, 2022: a case-control study. Frontiers in Veterinary Science. Doi: 10.3389/vets.2023.1229008
It is hoped that APHIS recognises the need to provide the industry with science-based recommendations to prevent additional incident HPAI outbreaks. This presumes prompt analysis and reporting of whatever field and molecular epidemiology is collected. APHIS is presumed to have planned epidemiologic field studies and allocated personnel and other resources in anticipation of a spring 2024 resurgence in HPAI. Given that large complexes in six states were infected during November and December 2023 and again in April 2024, appropriate guidance from USDA-APHIS is anticipated by the Industry for the spring 2024 reoccurence in progress. A release on the investigation of risk factors associated with outbreaks in dairy herds and a comment on whether mutations have occurred in viruses isolated from infected animals would be instructive. It would appear that within a day of the belated release of 239 sequences from domestic poultry, wild birds, dairy cows and terrestrial mammals, molecular epidemiologists have added to the knowledge of the origin of infection affecting commercial poultry and dairy herds. (see Editorial in this Edition)